

Windows 10 (and Server) Event Logs to Azure Log Analytics Walkthru
It’s a Cloud, Cloud, Cloud, Cloud, Cloud, Cloud world. Except actually most of your stuff is still likely mostly on-prem, or acts that way. Take Windows 10 for instance. Windows 10 has events in the event logs, and maybe you already know about on-prem Event Forwarding.
Tip: If you want to learn more about on-prem Event Forwarding, you can see my Walkthrough of that here video and text.
But how do we take on-prem events from Windows 10 (or Windows Server) and get the up to the cloud for later analysis? If you have 24, 250, or 25,000 domain joined (or even NON-domain joined) machines, say with Windows Intune or PolicyPak Cloud… how can you do the equivalent of event forwarding to some central place?
That is the job of Azure Log Analytics. I’m going to call it “LA” for short.
LA had an original name, OMS which stood for Operations Management Suite, but as near as I can tell, that’s over. But its good to know LA’s original name, because you’ll see OMS pop up from time to time in the walkthrough, docs, and software. Additionally, it’s also good to know that what you’ll see here is build upon the original System Center Microsoft Operations Manager (SCOM); but I won’t be using that function.
The official documentation for LA can be found here; but I had a few stumbles. Some tips o’ the hat to Travis Roberts’ video and blog which also helped give me a leg up. The blog is here and the helpful video series on Azure Log Analytics (though a little old now because of the name and UI changes) can be found at: https://www.youtube.com/watch?v=6hgvjgPBNzE&list=PLnWpsLZNgHzVXXyN9a0jm9xNNDrikHf8I
My goal in researching this project was to give some PolicyPak MDM Customers a quick guide to research interesting events that PolicyPak automatically logs to its own event log. But in this guide, I’m also going to show you how to collect some standard and also some extra event logs.
To get started you need a Log Workspace. This is basically a security block between this collection of logs, and say another collection of logs. Each Log Workspace has a GUID based Workspace ID and two keys (Primary and Secondary.) You’ll use these to send, say, YOUR Windows 10 machines’ event logs to your workspace. And the other Azure admins … you know, those SQL server people or Exchange or whatever … they’ll send their event logs to their workspaces.
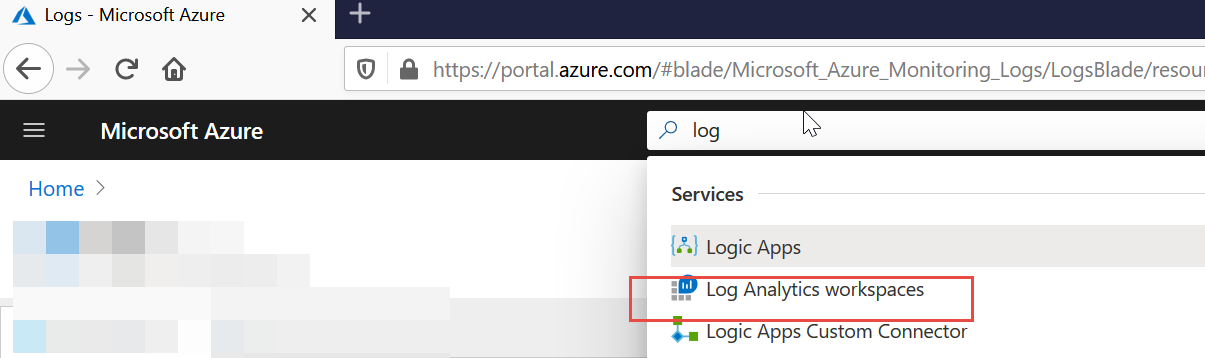
To get started use the big search thingie to find “Log Analytics workspaces” like what’s seen here.
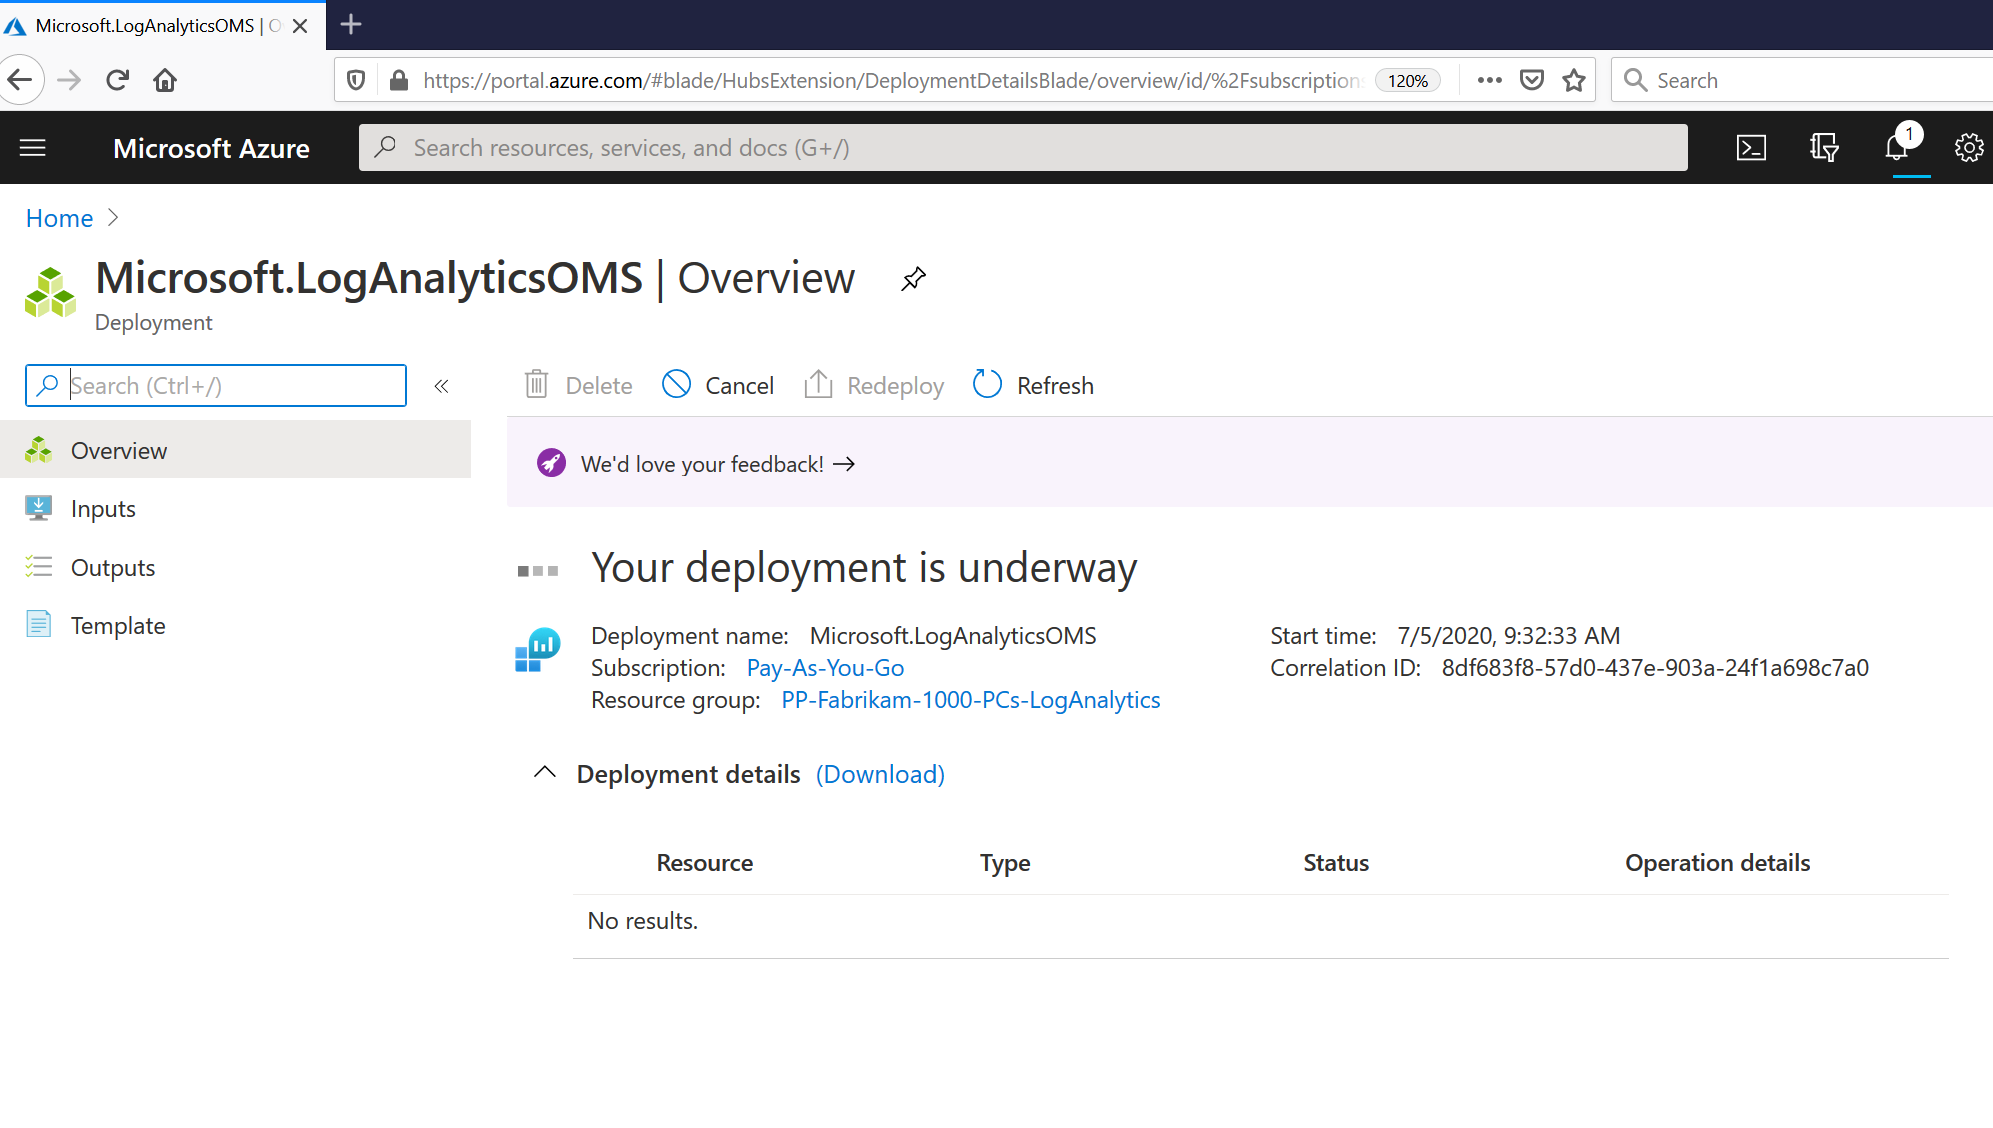
Then, there’s a little Wizard (not shown) to help you get started. Basically it’s asking you for names and which Azure region you want to keep the data in. Then after it gets going you’ll see “Your deployment is underway” like what’s seen here.
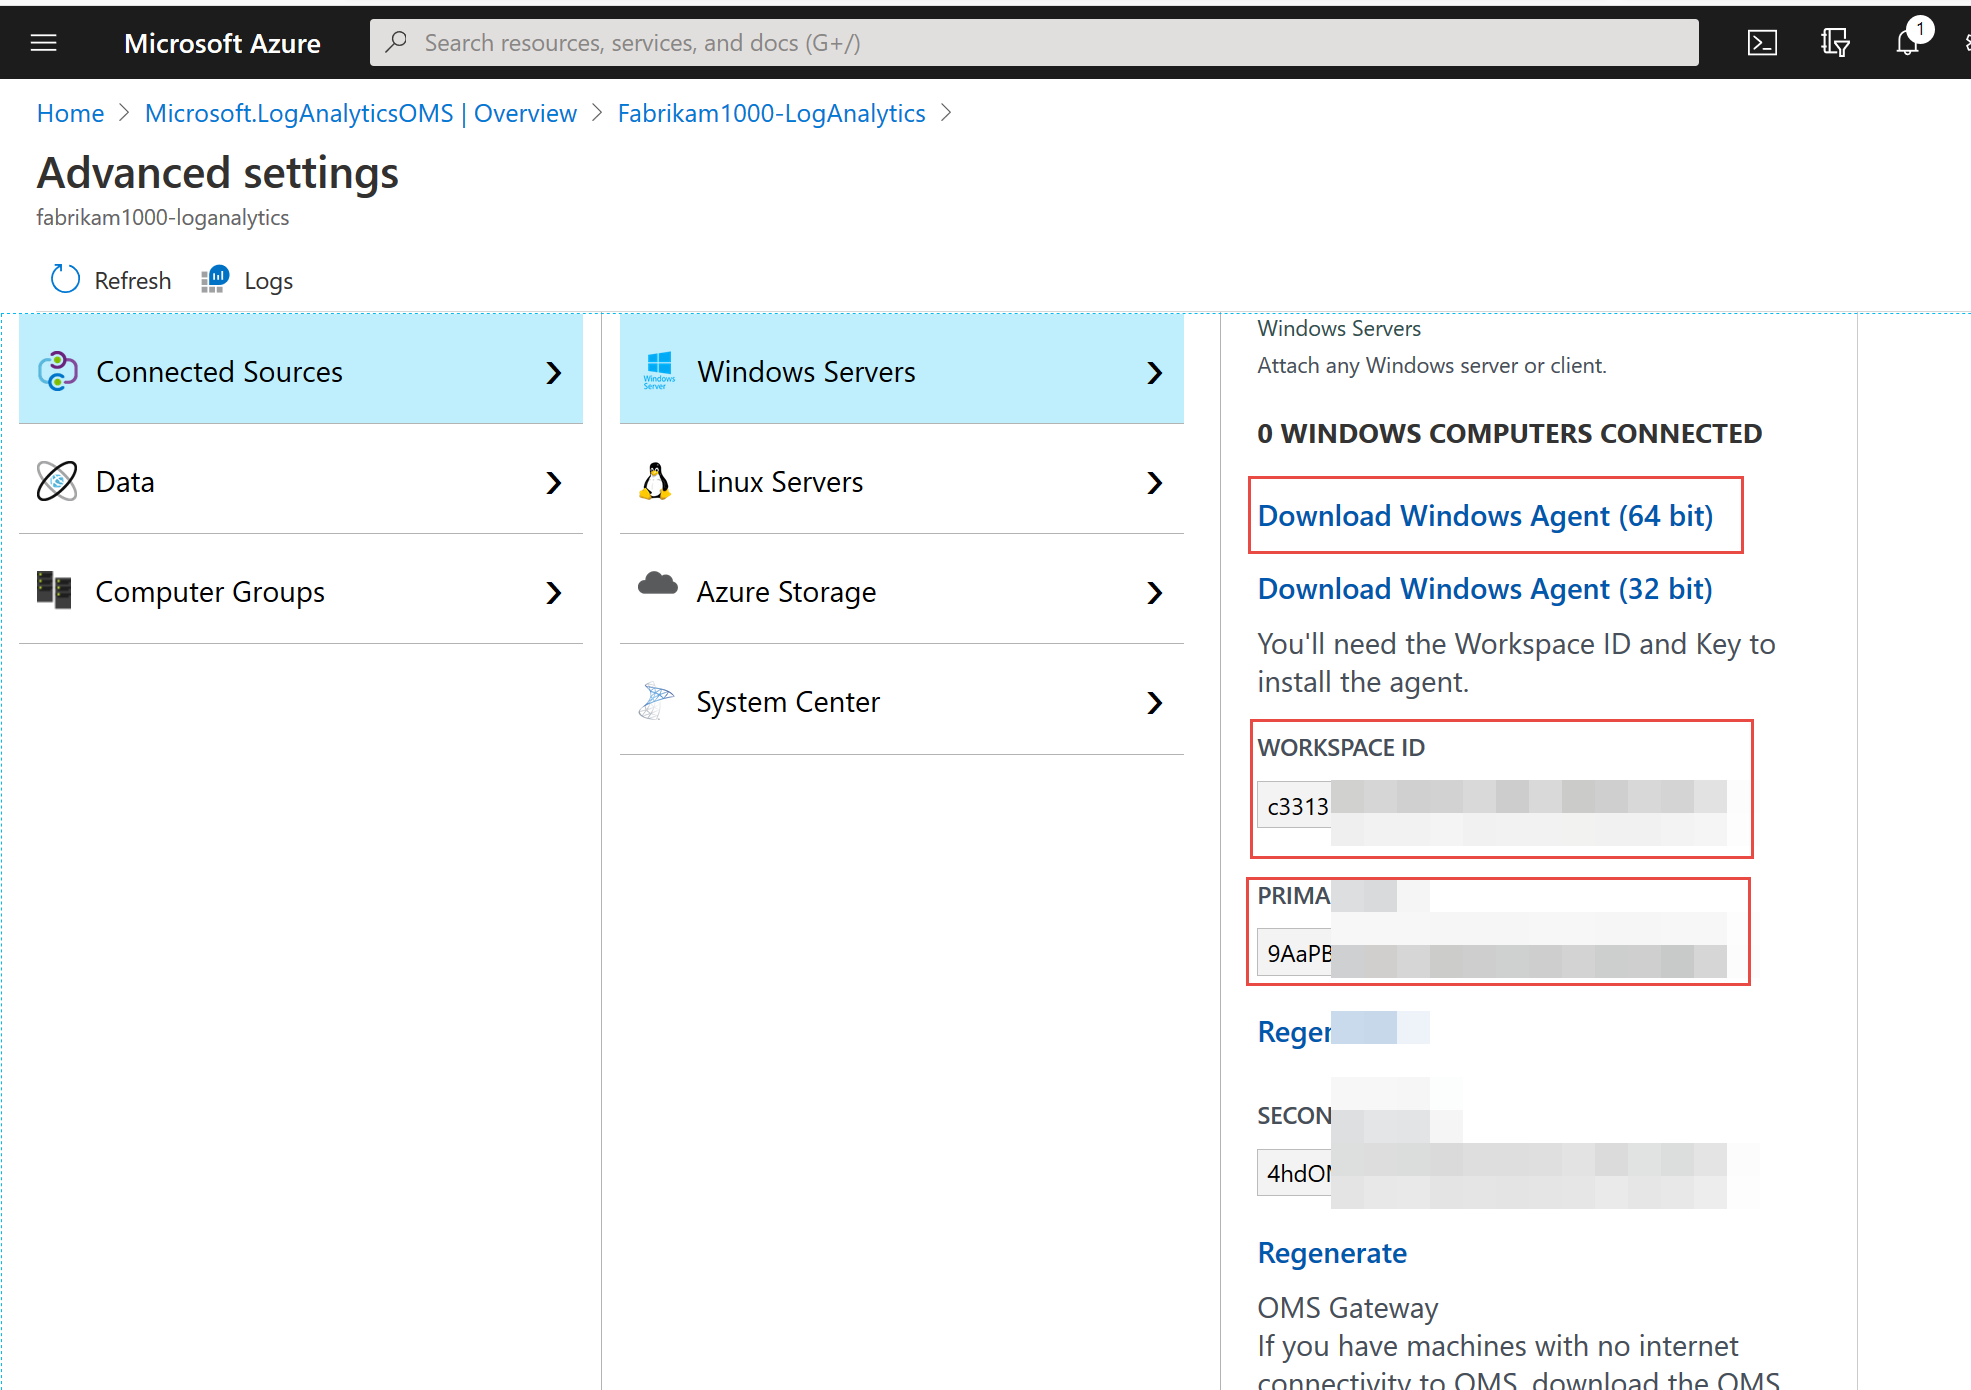
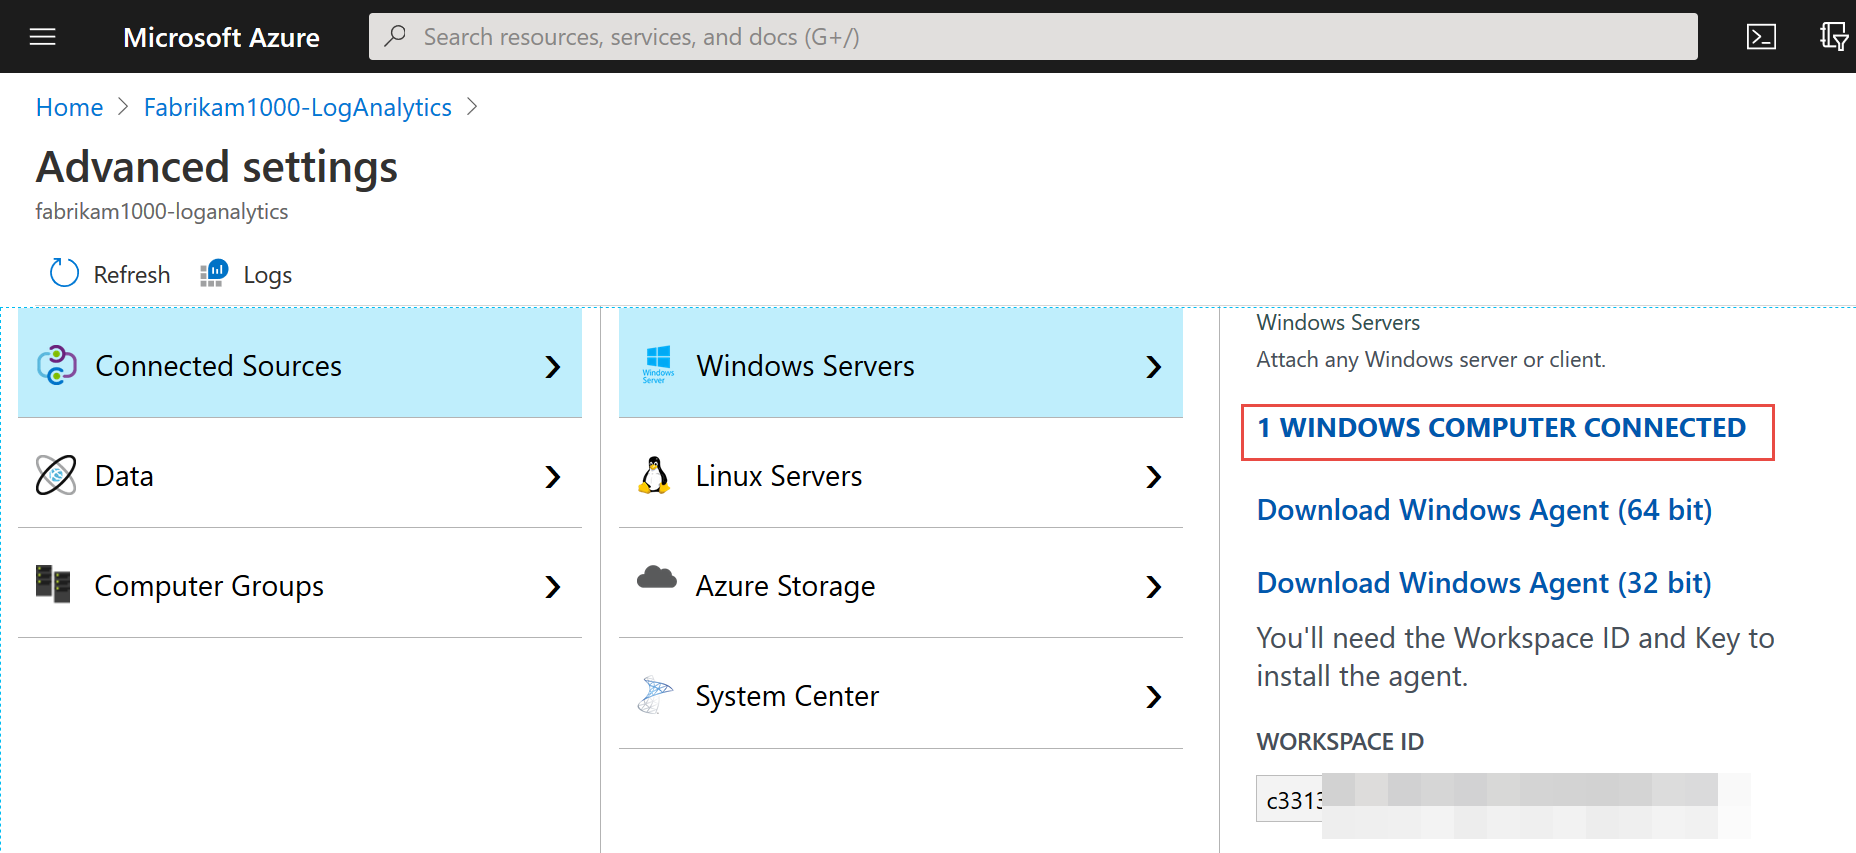
Then you should be thrown into the Advanced settings like what’s seen here. If not, find the Workspace you just created and click Advanced in the left-side menu. It should get you to this place. Note then the “WORKSPACE ID” and “PRIMARY KEY” like what’s seen here. Hang on to those, you’ll need these in a bit. Then also download the Windows Agent 64-bit or 32-bit to get started for your example machines.
In this example, we’ll be installing the LA Agent by hand on a test machine. In real life you could use, say Windows Intune to deploy it with command line options to just chuck in your Workspace ID and Primary Keys and do the whole thing silently and automatically.
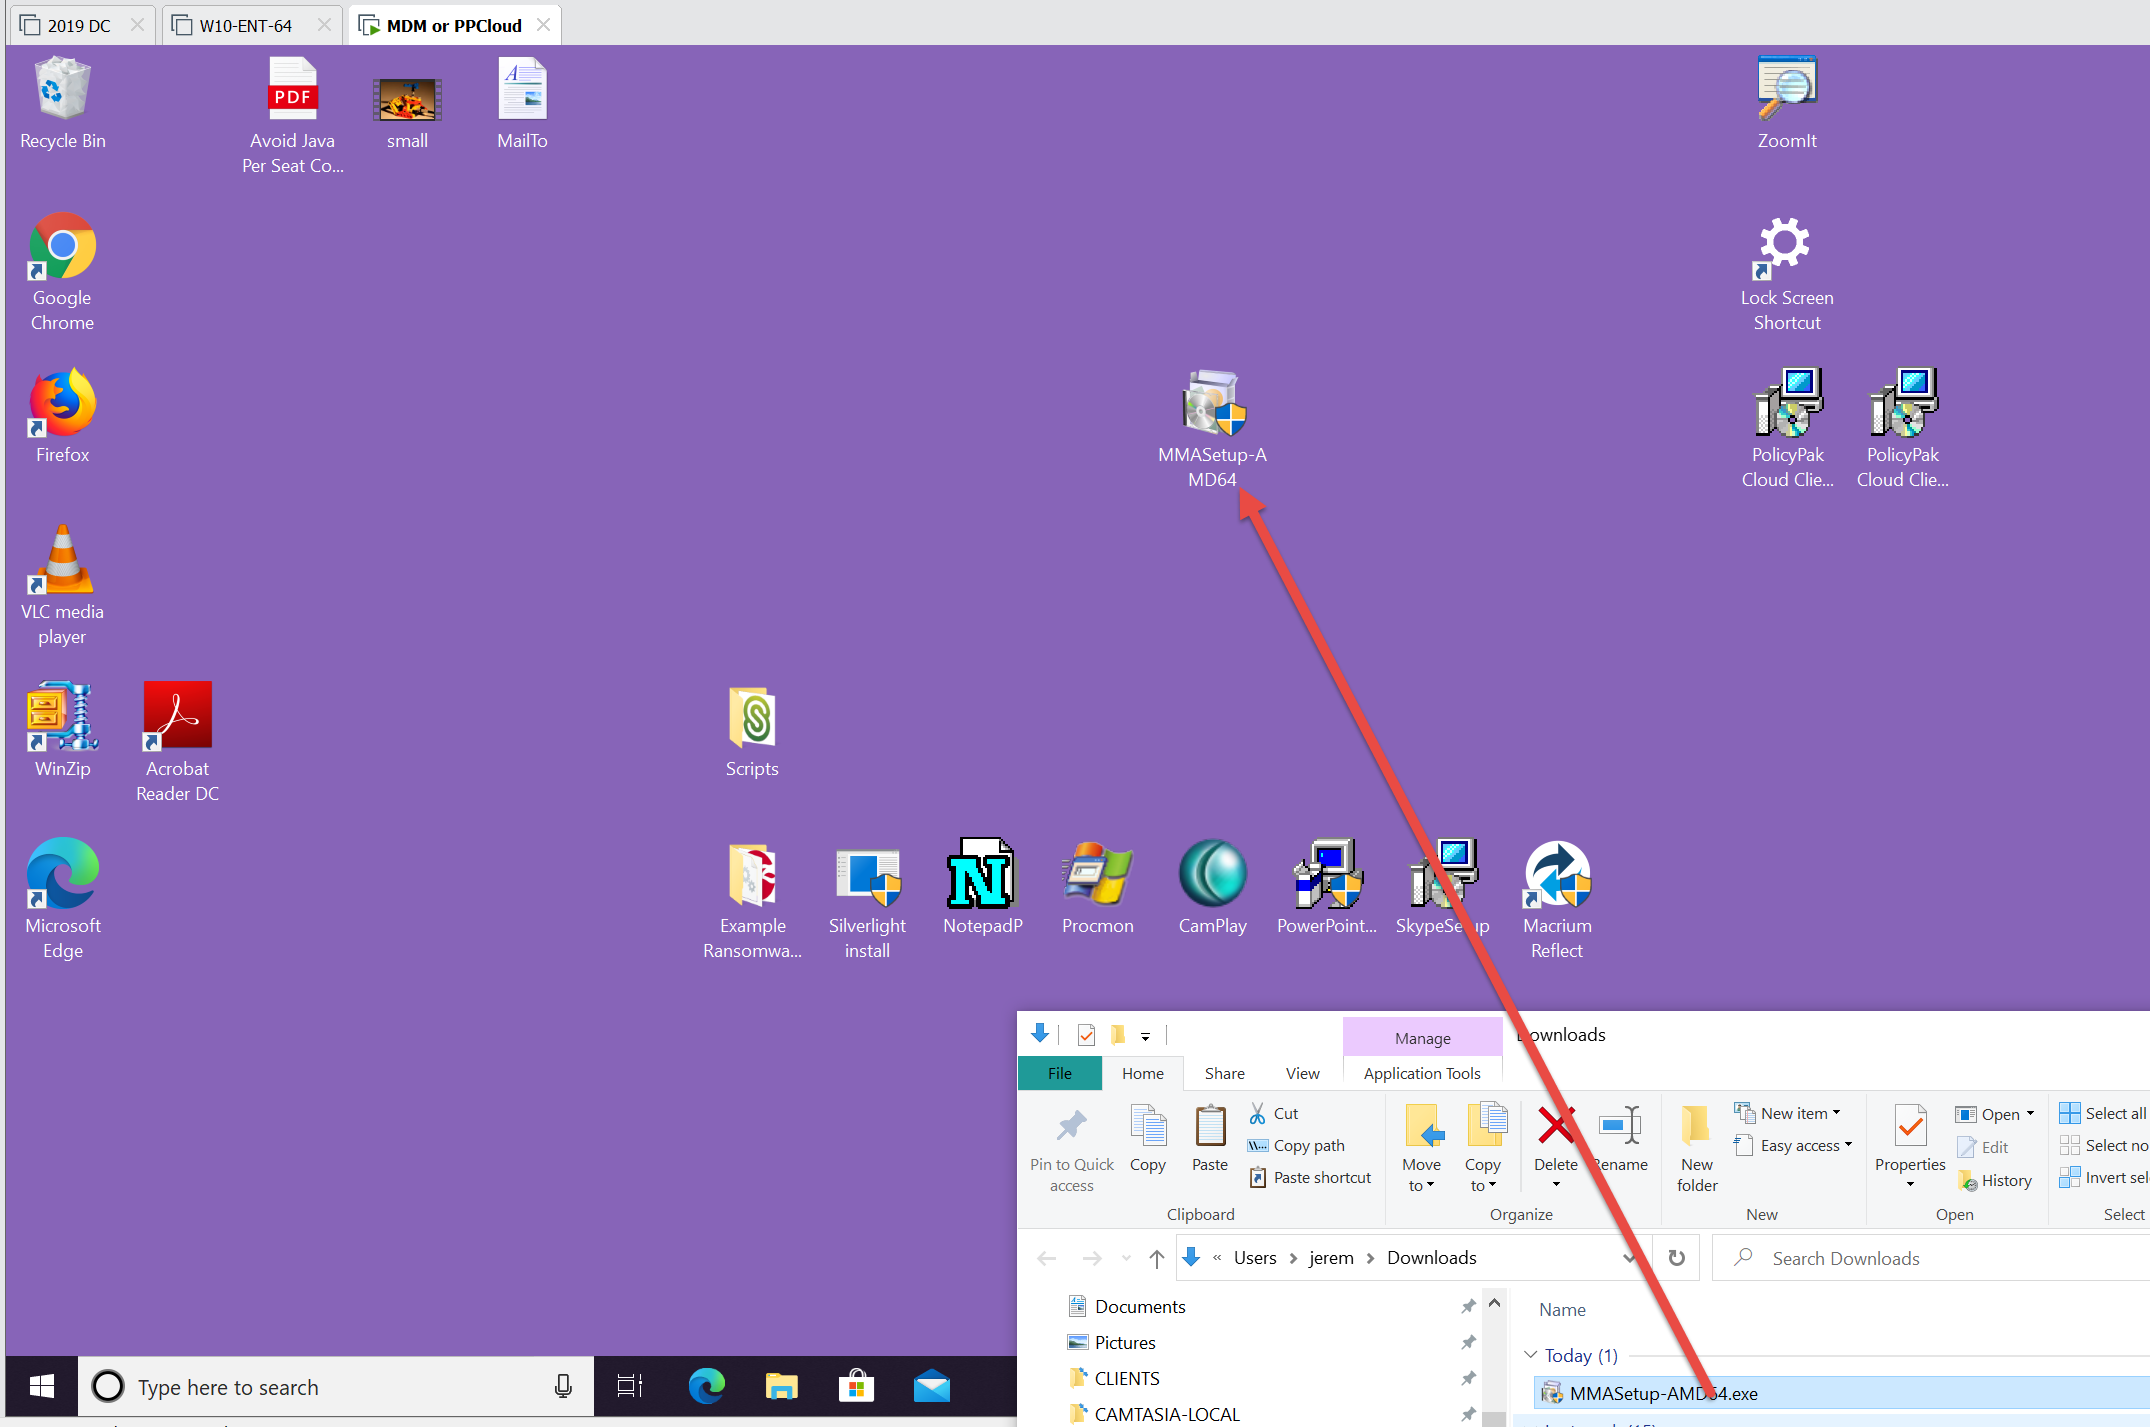
Once you have the download, get it over to your test machine. Machine can be real or virtual. Note that you shouldn’t do this (nor do you need to) for WVD virtual machines. Those have a magical connector to accept event logs to LA; and you shouldn’t need to use this method. (Docs: https://docs.microsoft.com/en-us/azure/virtual-desktop/diagnostics-log-analytics and a blog https://www.mdmandgpanswers.com/blogs/view-blog/windows-10-and-server-event-logs-to-azure-log-analytics-walkthru)
Then, Up, Up and away. Launch the agent.. which requires admin rights. (Or, pro tip: Use PolicyPak Scripts to install it automatically where the script is elevated. https://kb.policypak.com/kb/article/901-policypak-scripts-deploy-software-via-vpn-or-with-policypak-cloud/ )
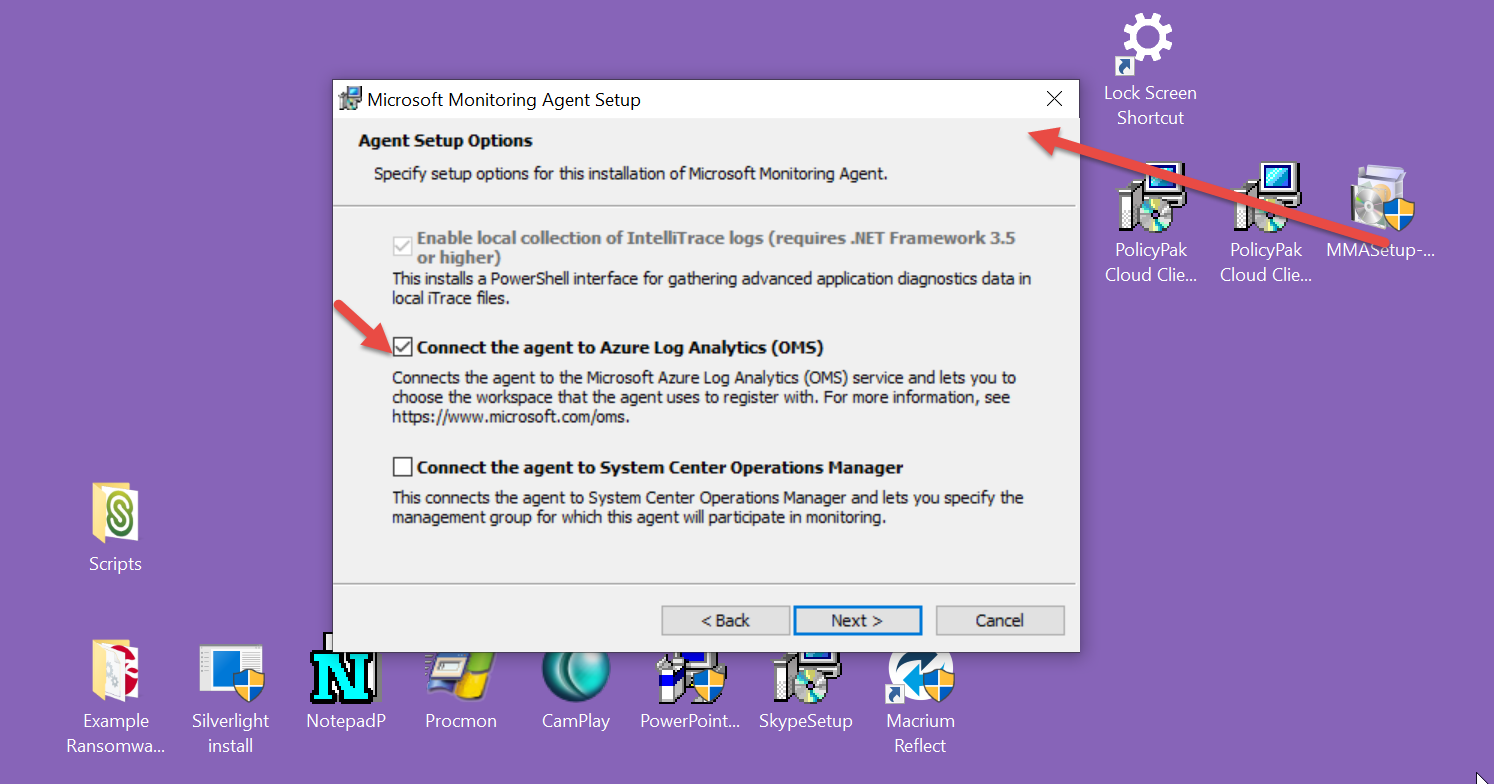
You’ll need to select “Connect the agent to Azure Log Analytics (OMS)” like what’s seen here.
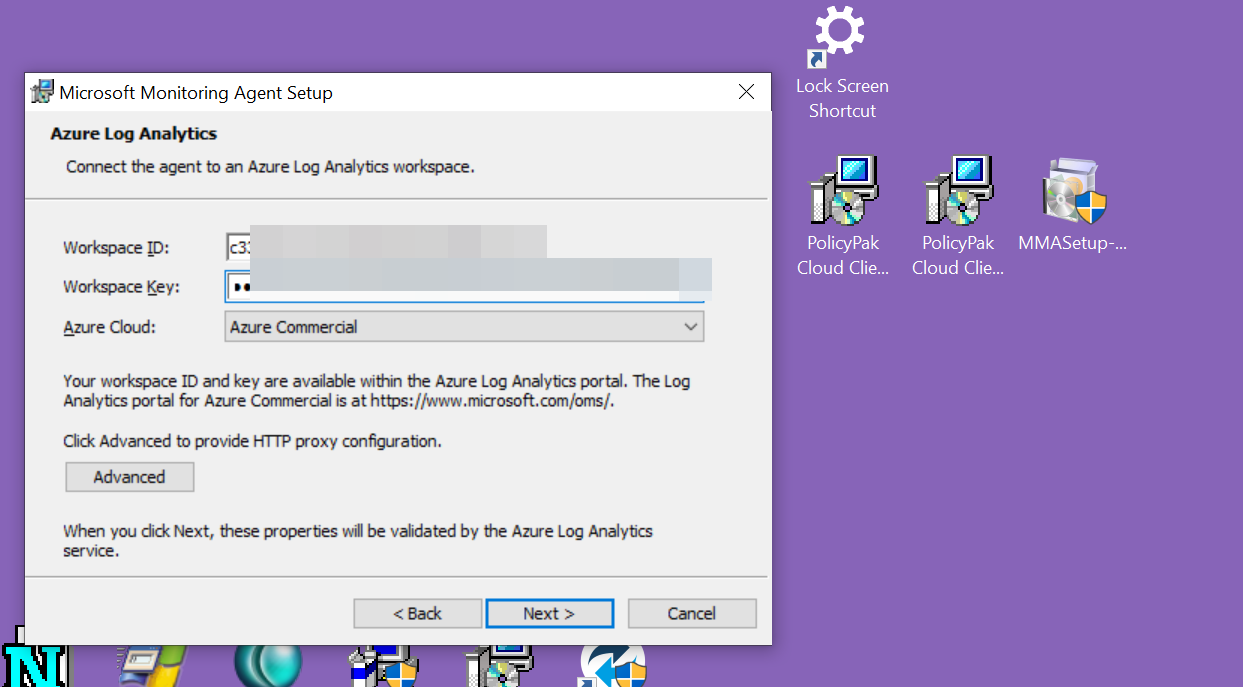
Then, it’s time to chuck in your Workspace ID and Workspace Key. And you’ll likely keep the default of Azure Cloud: Azure Commercial. Pull the pulldown if you have something unusual to select here.
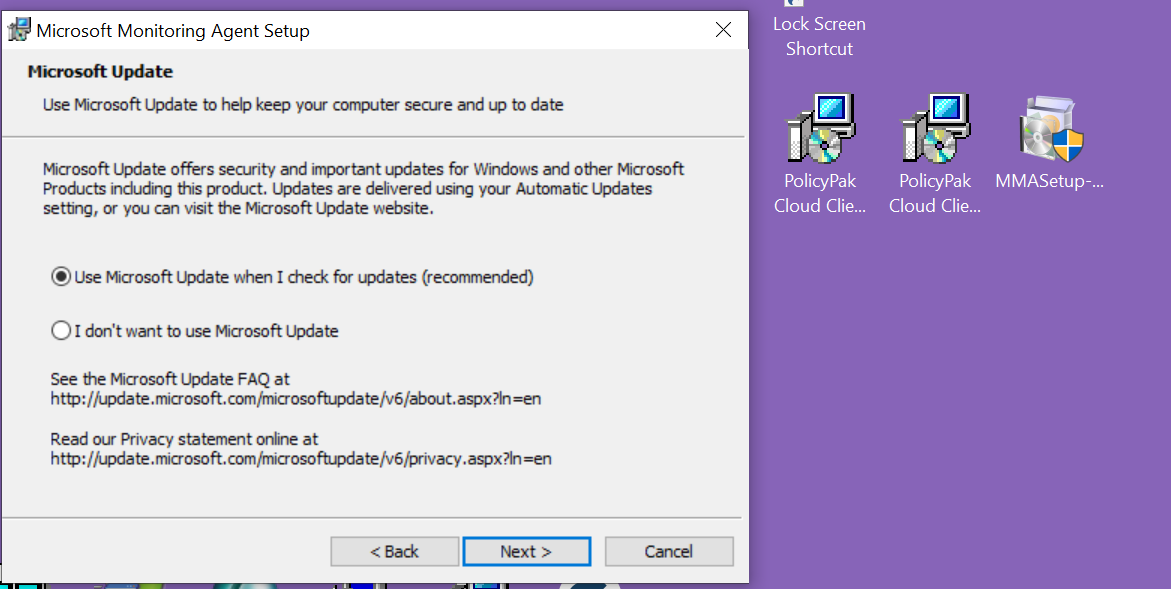
Yes, you want to check for updates when MS Update kicks in….
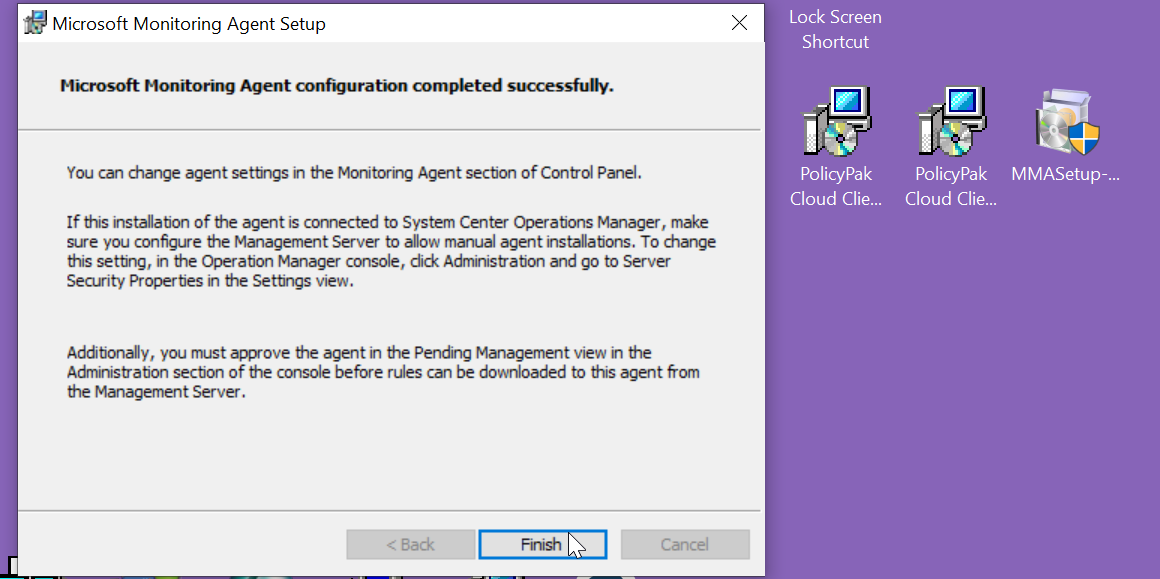
And.. you’re basically done.
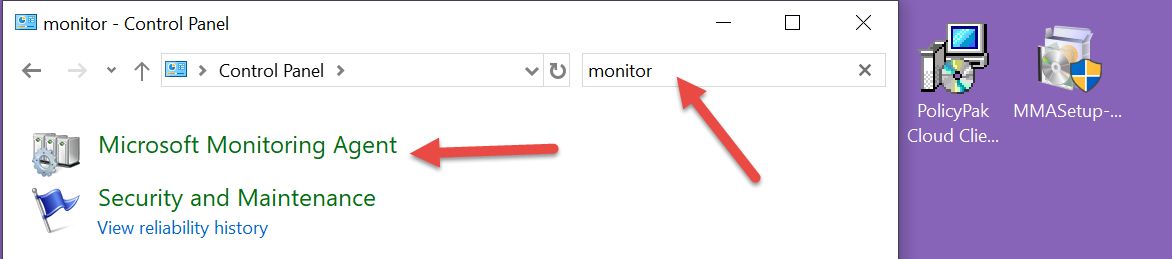
Now let’s make sure we’re talking in both directions. The Microsoft Monitoring Agent is found in Control Panel… which is a weird place, but, hey… that’s okay.
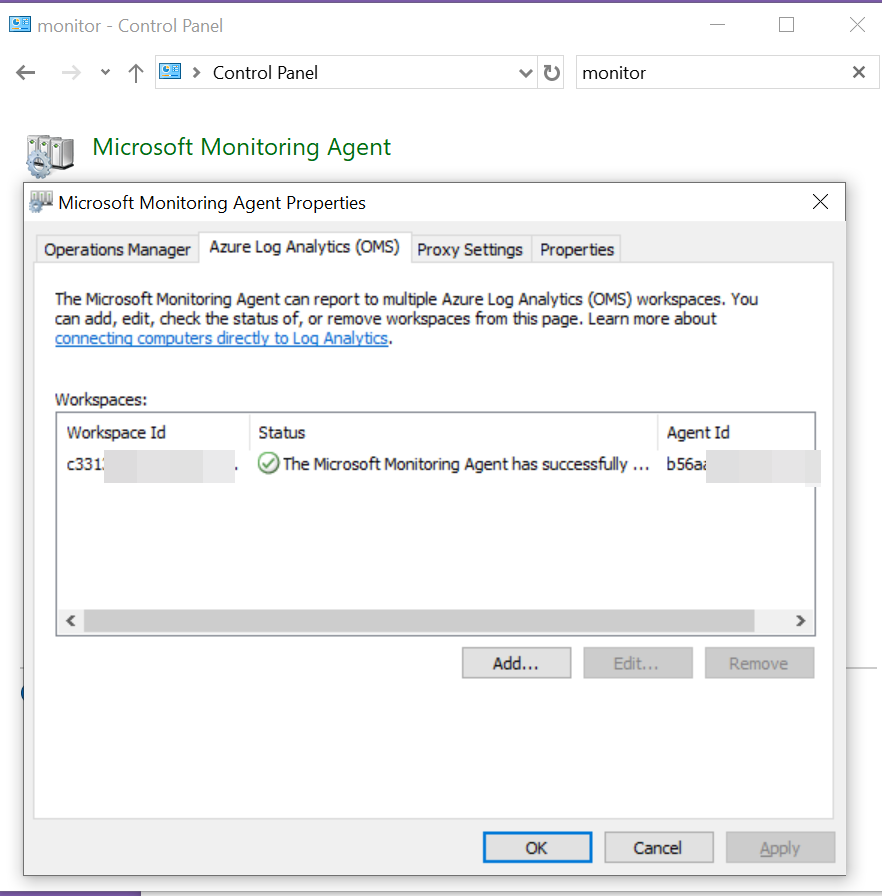
Then click the Azure Log Analytics (OMS) tab and … see you’re talking outbound.
Back in Azure, in the Advanced Settings page, the zero should be one !
Now it’s time to add in the actual event logs you want to capture. Note that the more you capture, the more you pay. Strictly speaking for the PolicyPak customer I made this blog entry for, he only needed to capture the PolicyPak log (which I do last.) But just for completeness and testing, I’ll capture some more too, since you might not have the PolicyPak Log. (And, why don’t you!? Come on over and check out PolicyPak for Pete’s sake. Really, your sake to be honest.)
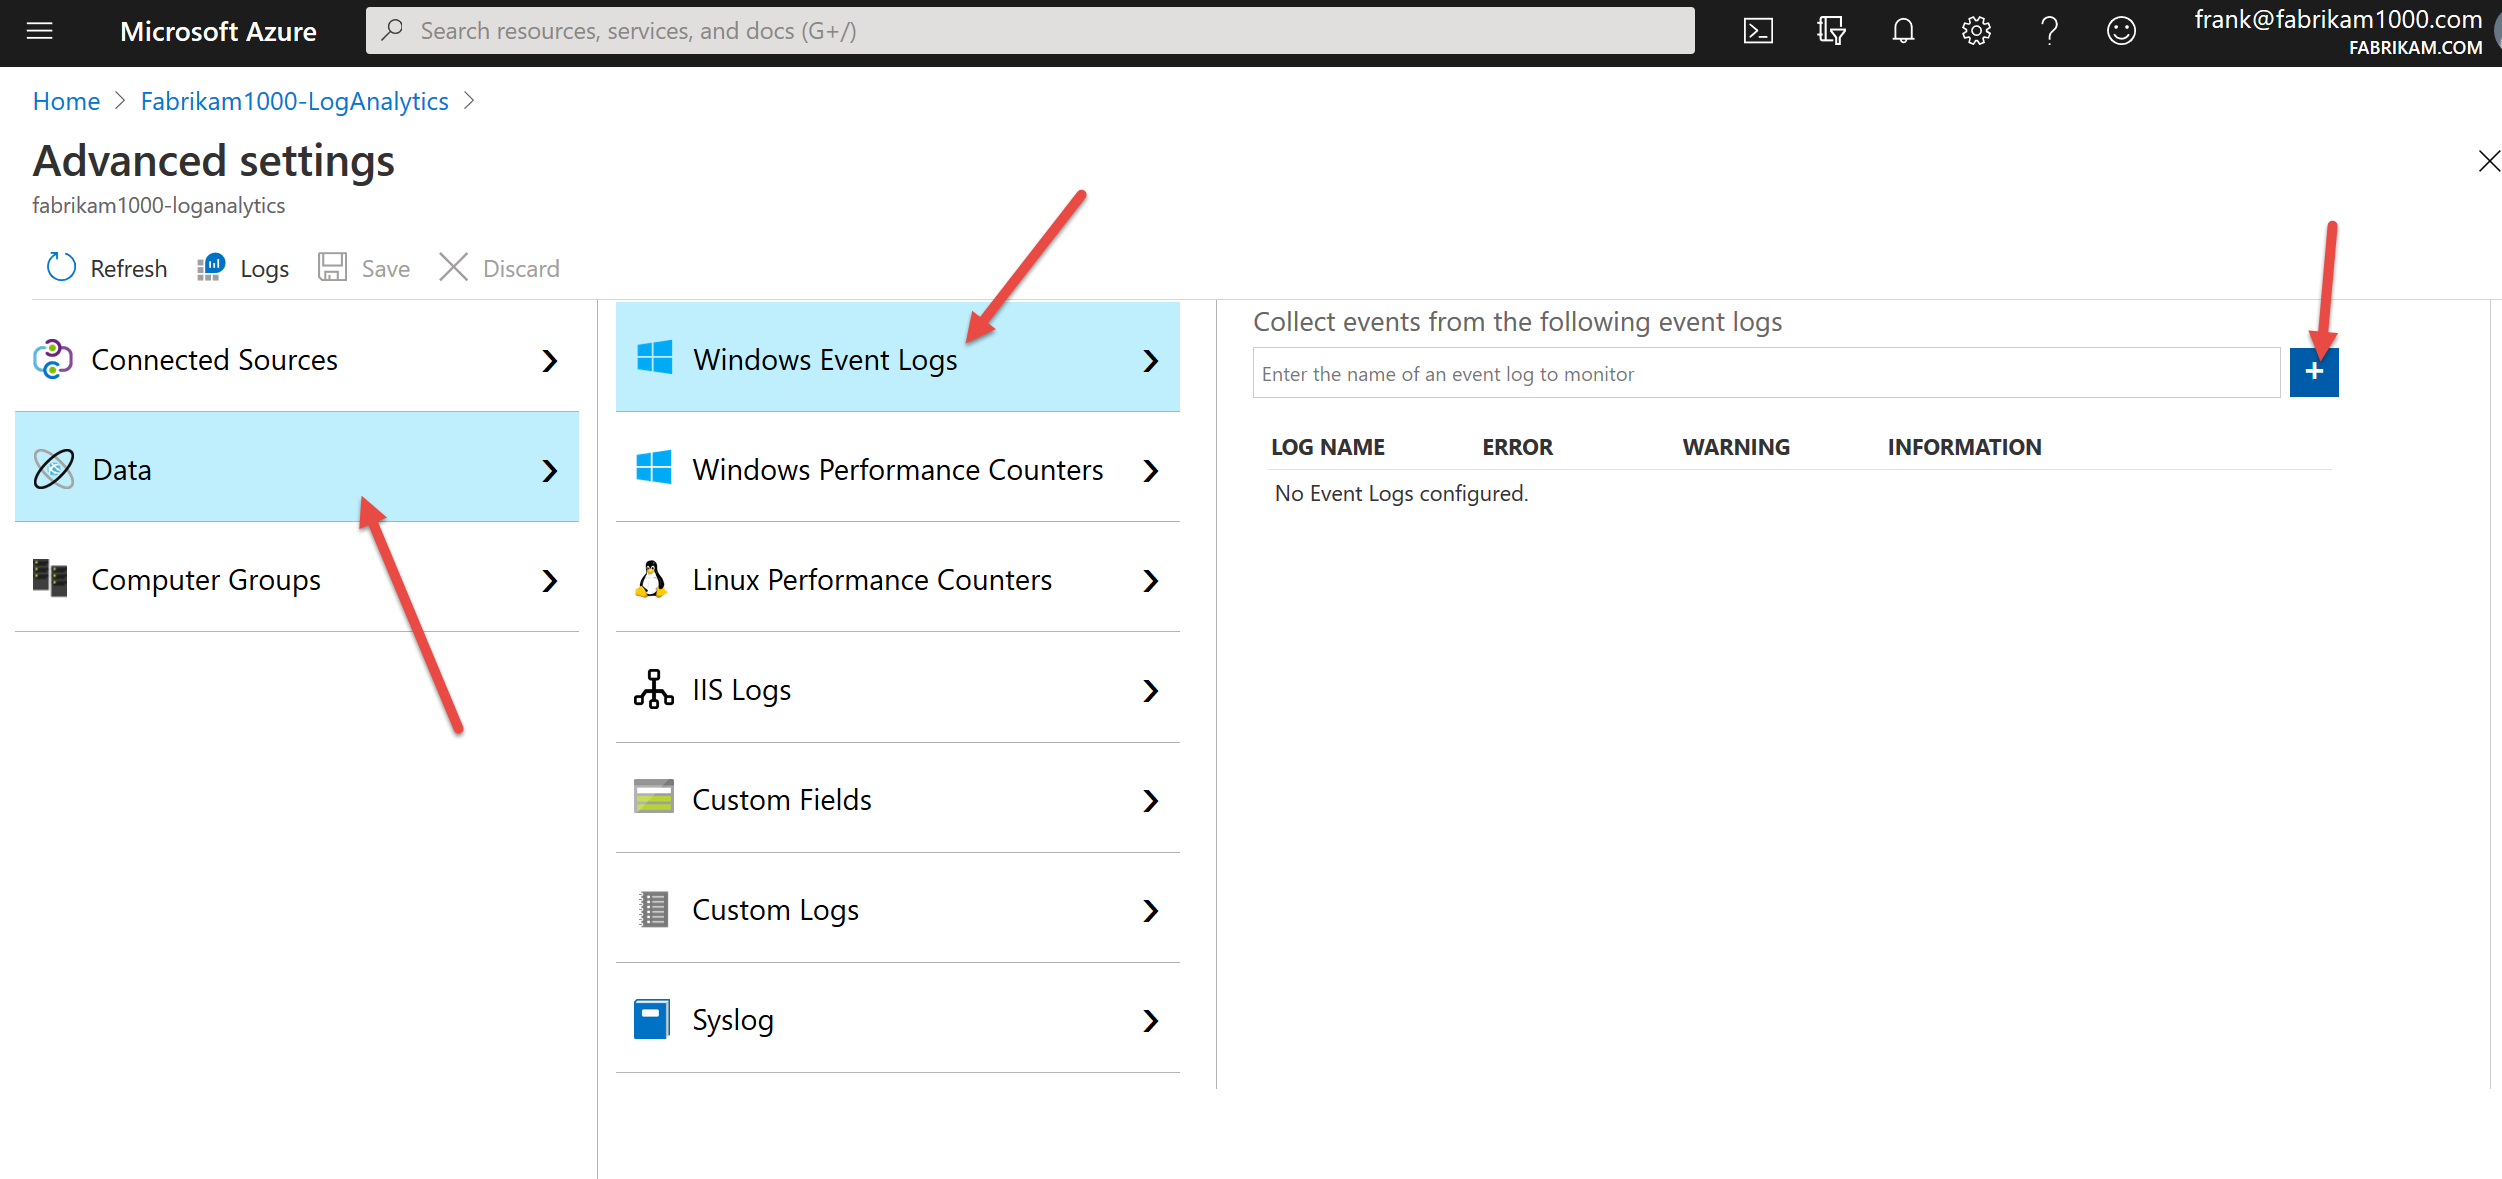
So just type Application then +. Then System and + and bingo. Those are “well known” logs which LA knows about and pre-populates this list. But PolicyPak? Not as common.. (Yet !) Therefore you could take a guess that our event logs are named PolicyPak (they are…). But how would you know?
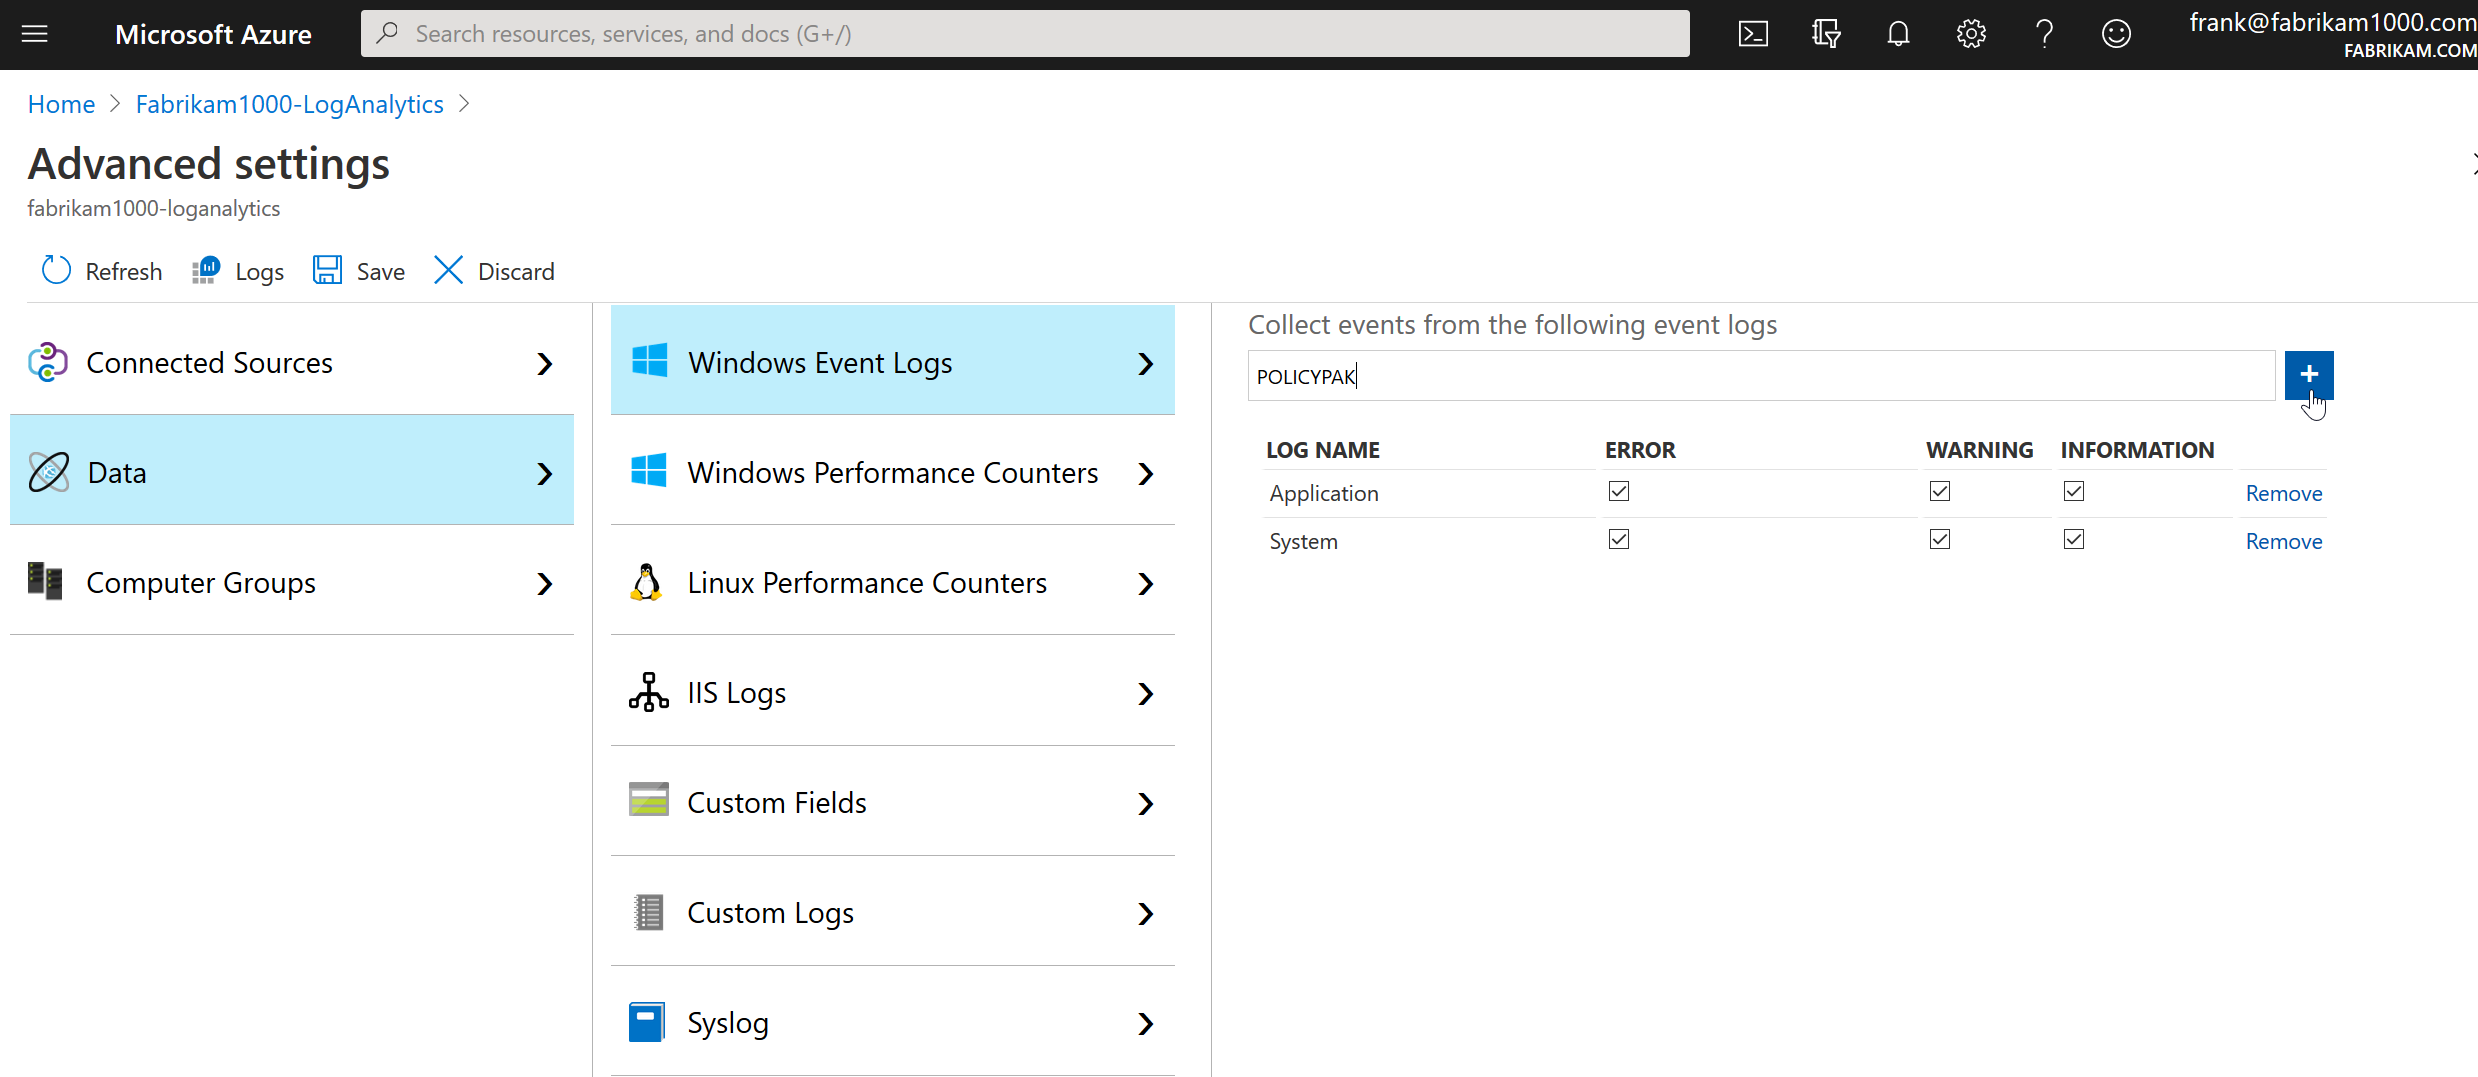
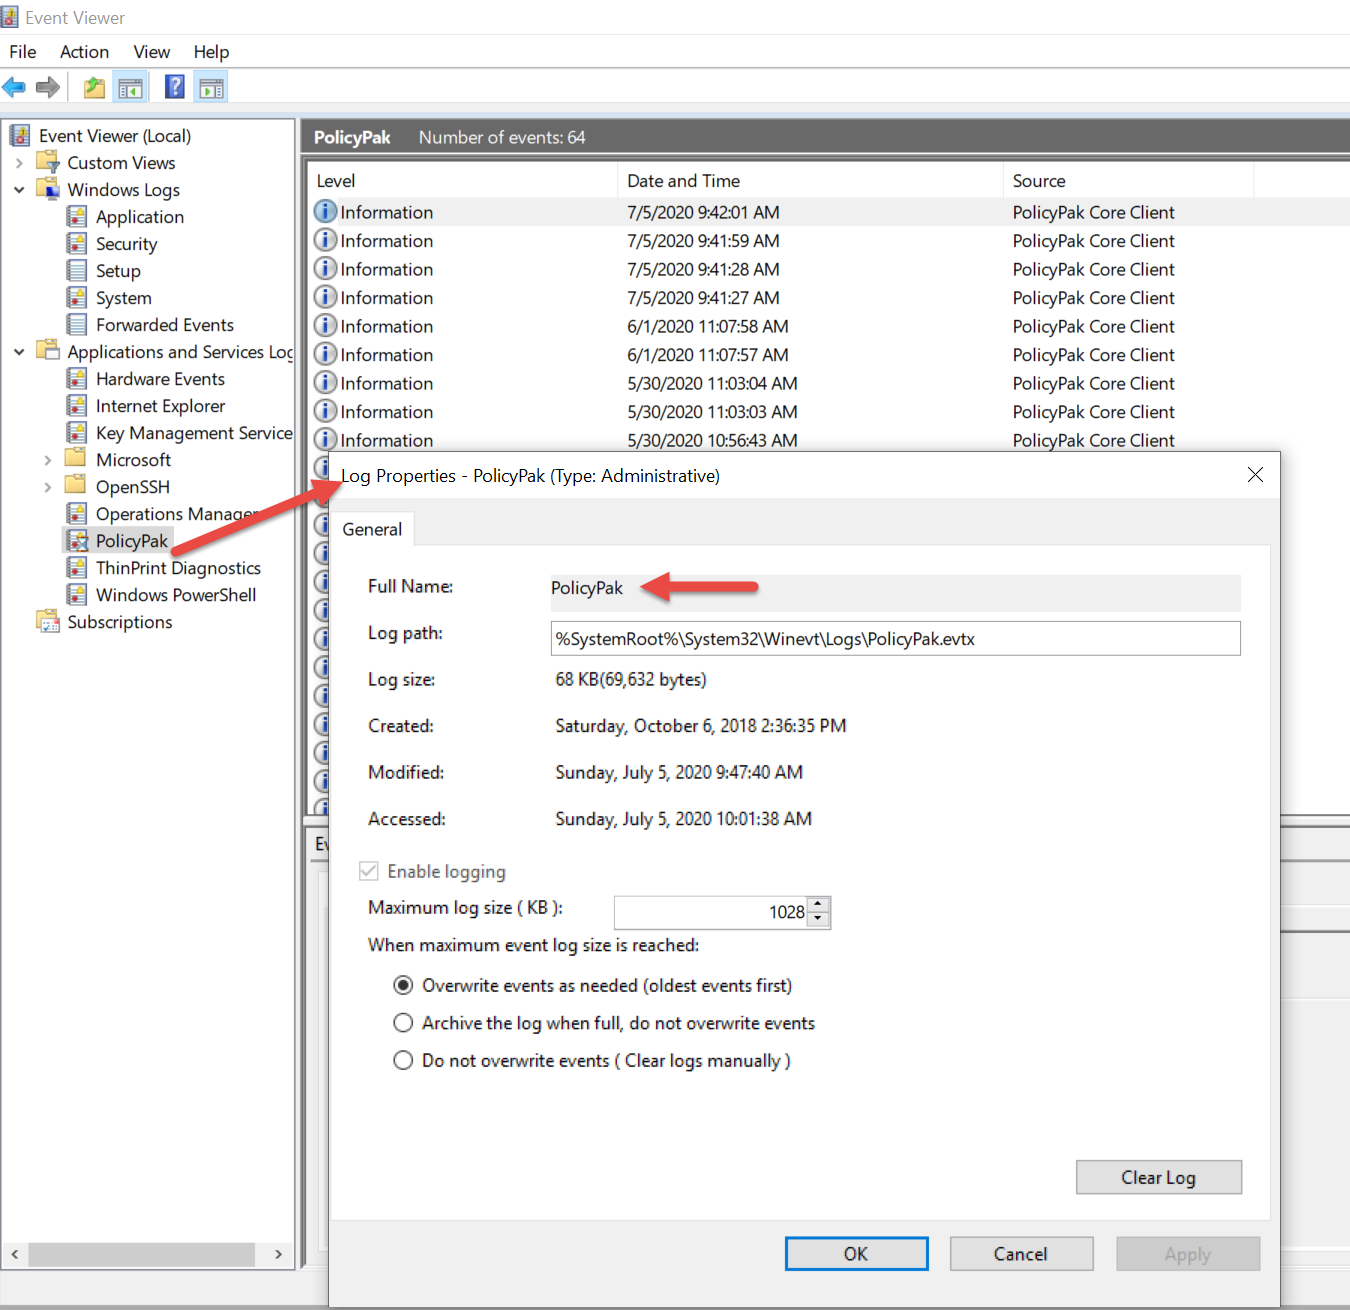
The trick is to find the log you want to capture in Windows, and go to its properties and get its Full Name like what’s seen here. Yeah, this one was easy.
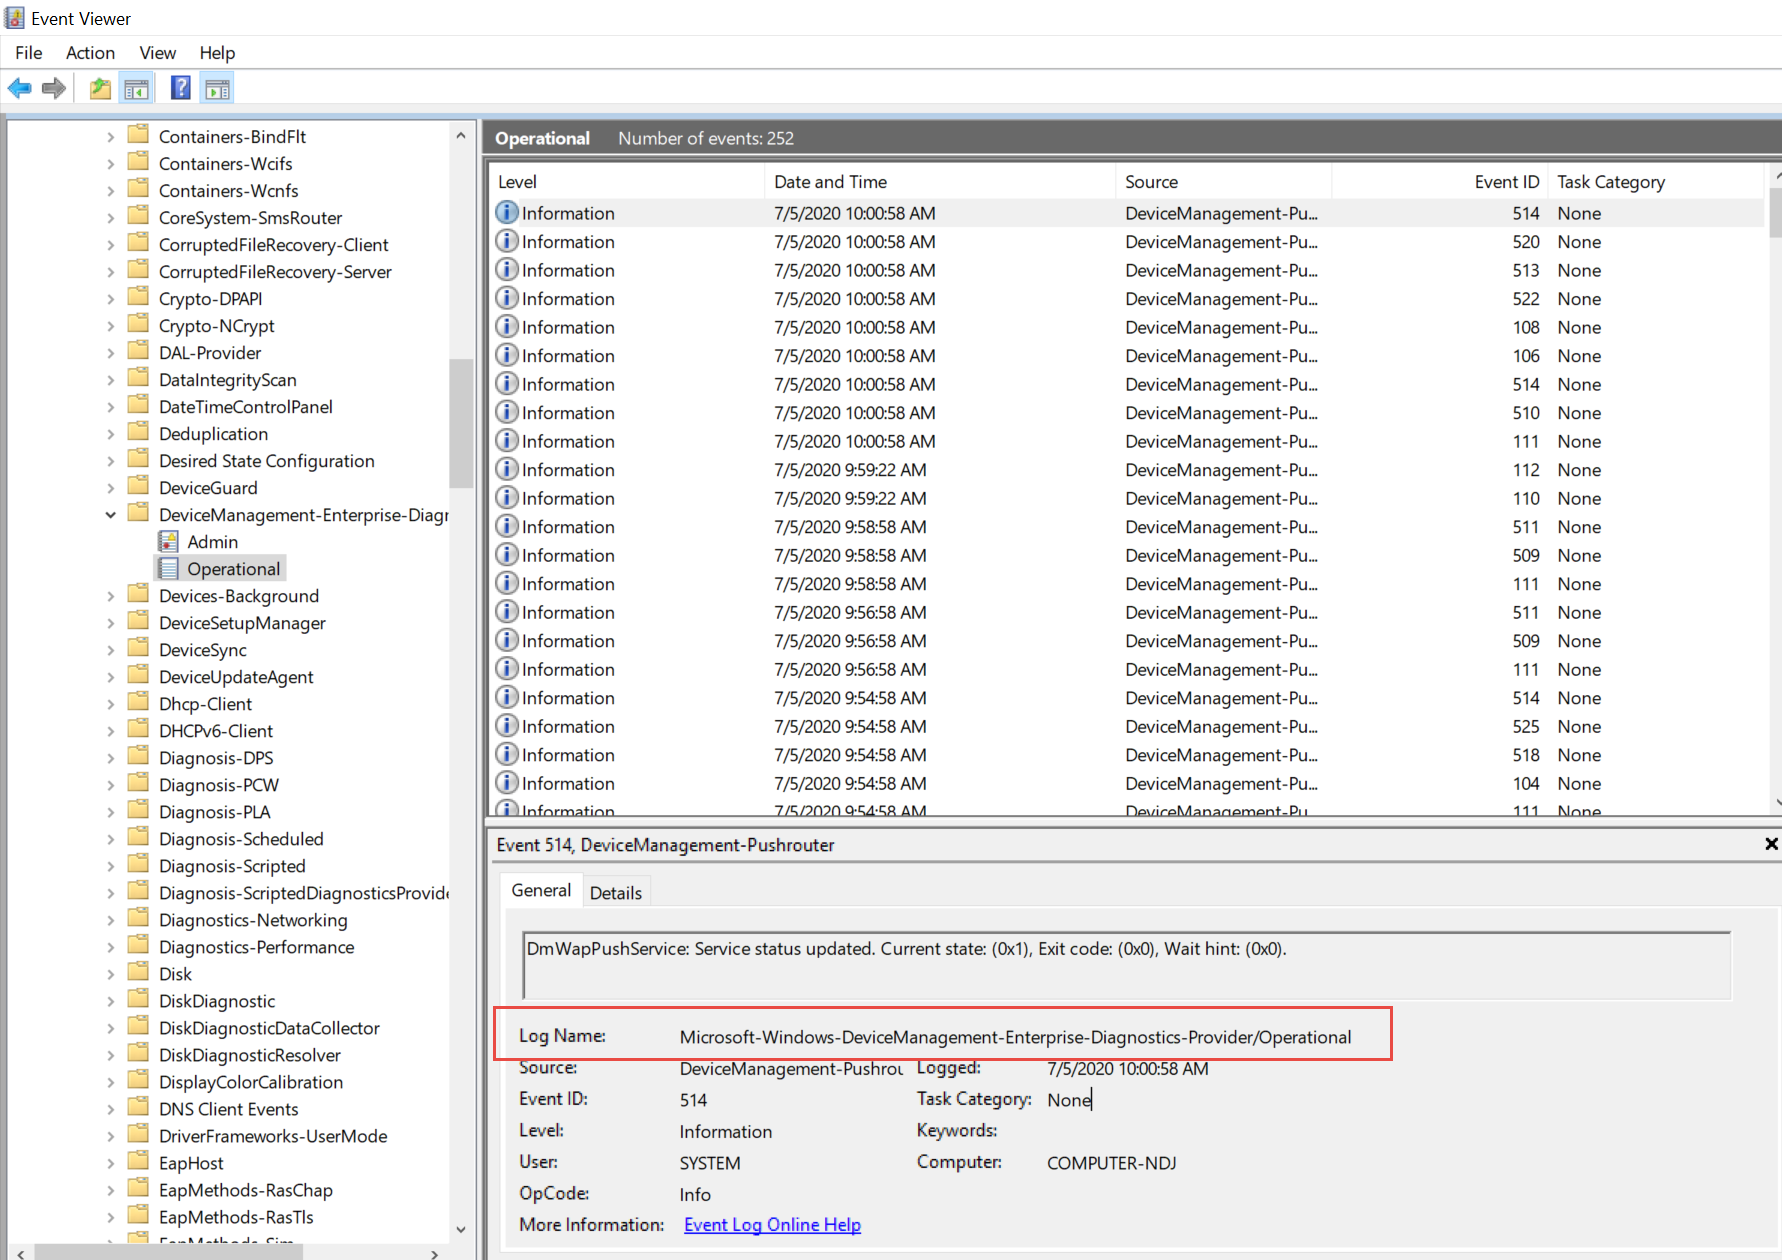
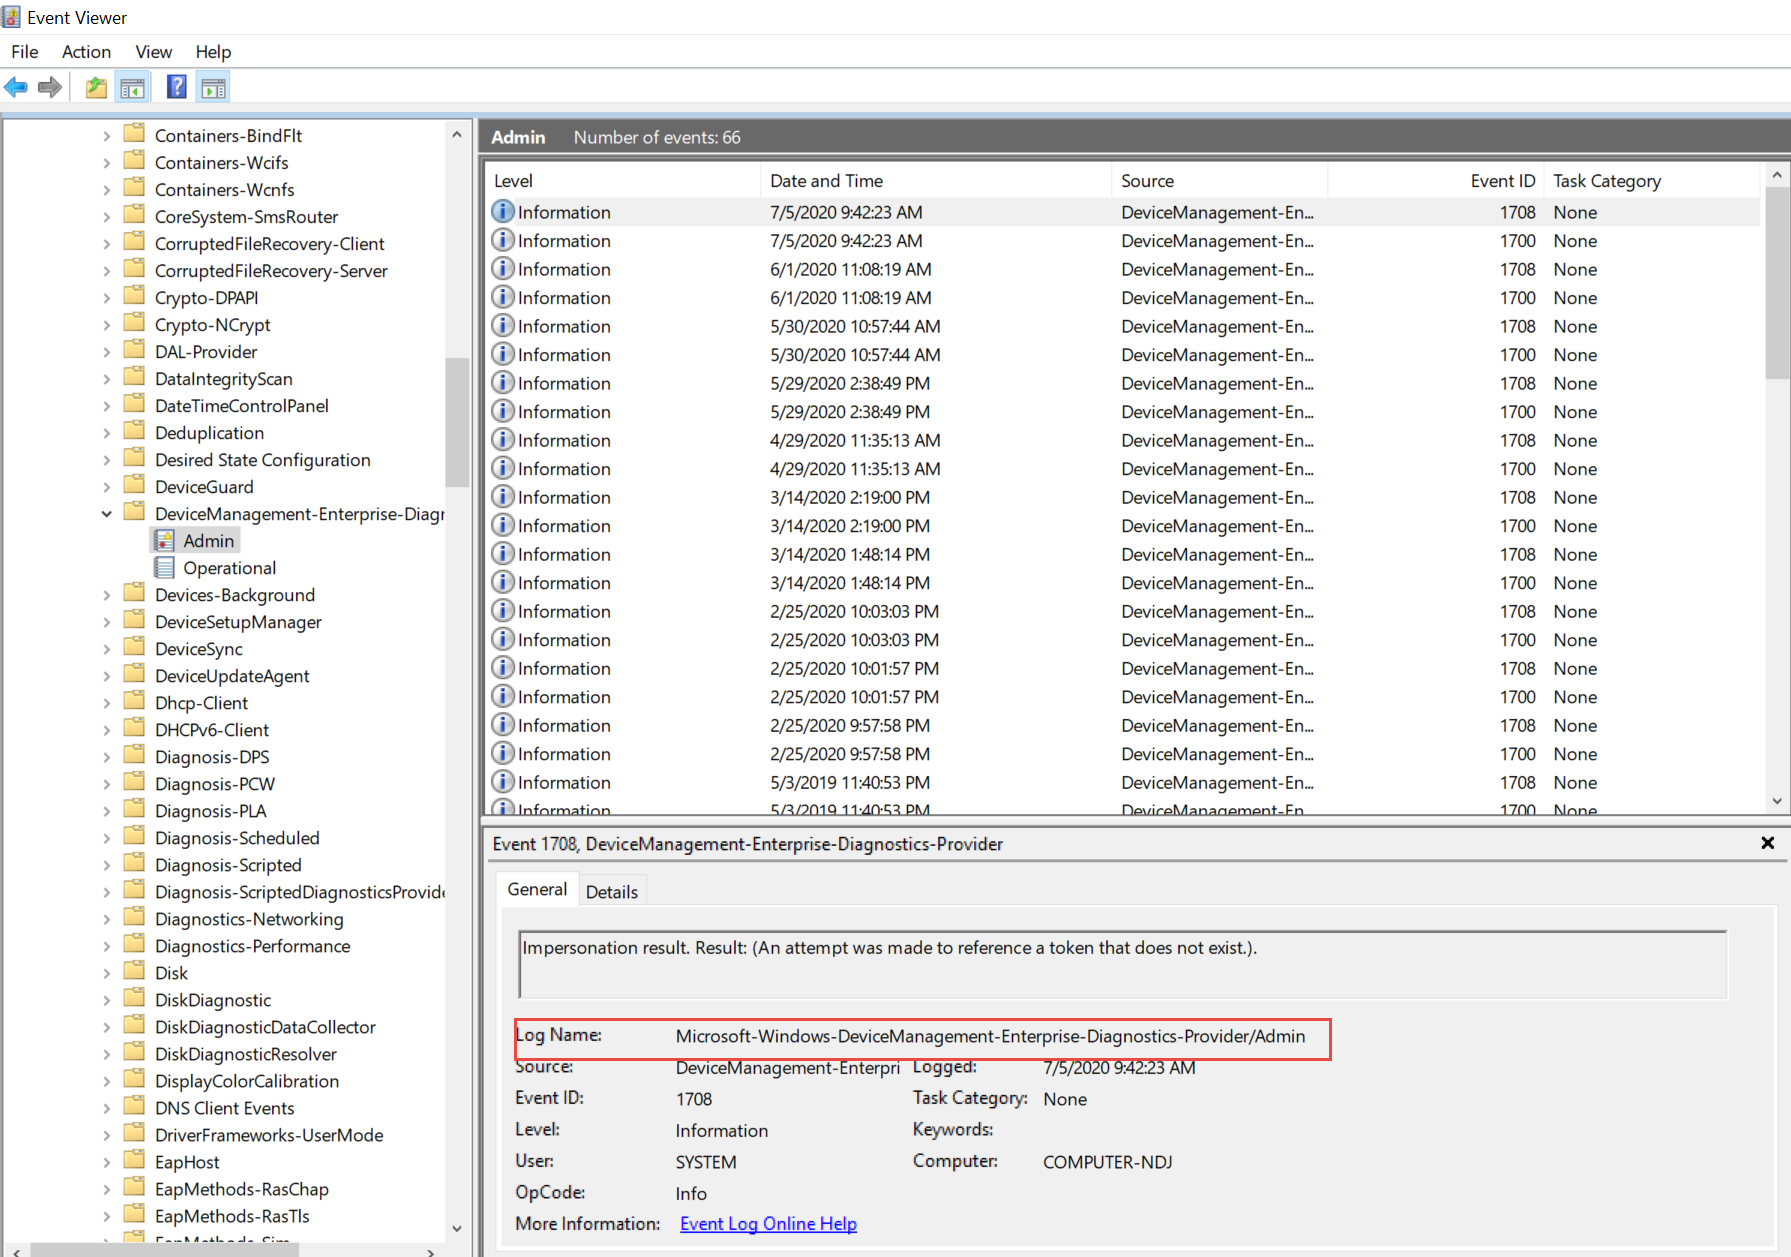
But some are harder. I also wanted to capture the MDM event log which has a goofy and weird name. To get it, I went into an Event inside that log and captured its name microsoft-windows-devicemanagement-enterprise-diagnostics-provider/Operational and its brother microsoft-windows-devicemanagement-enterprise-diagnostics-provider/admin.
You can see that second log here…
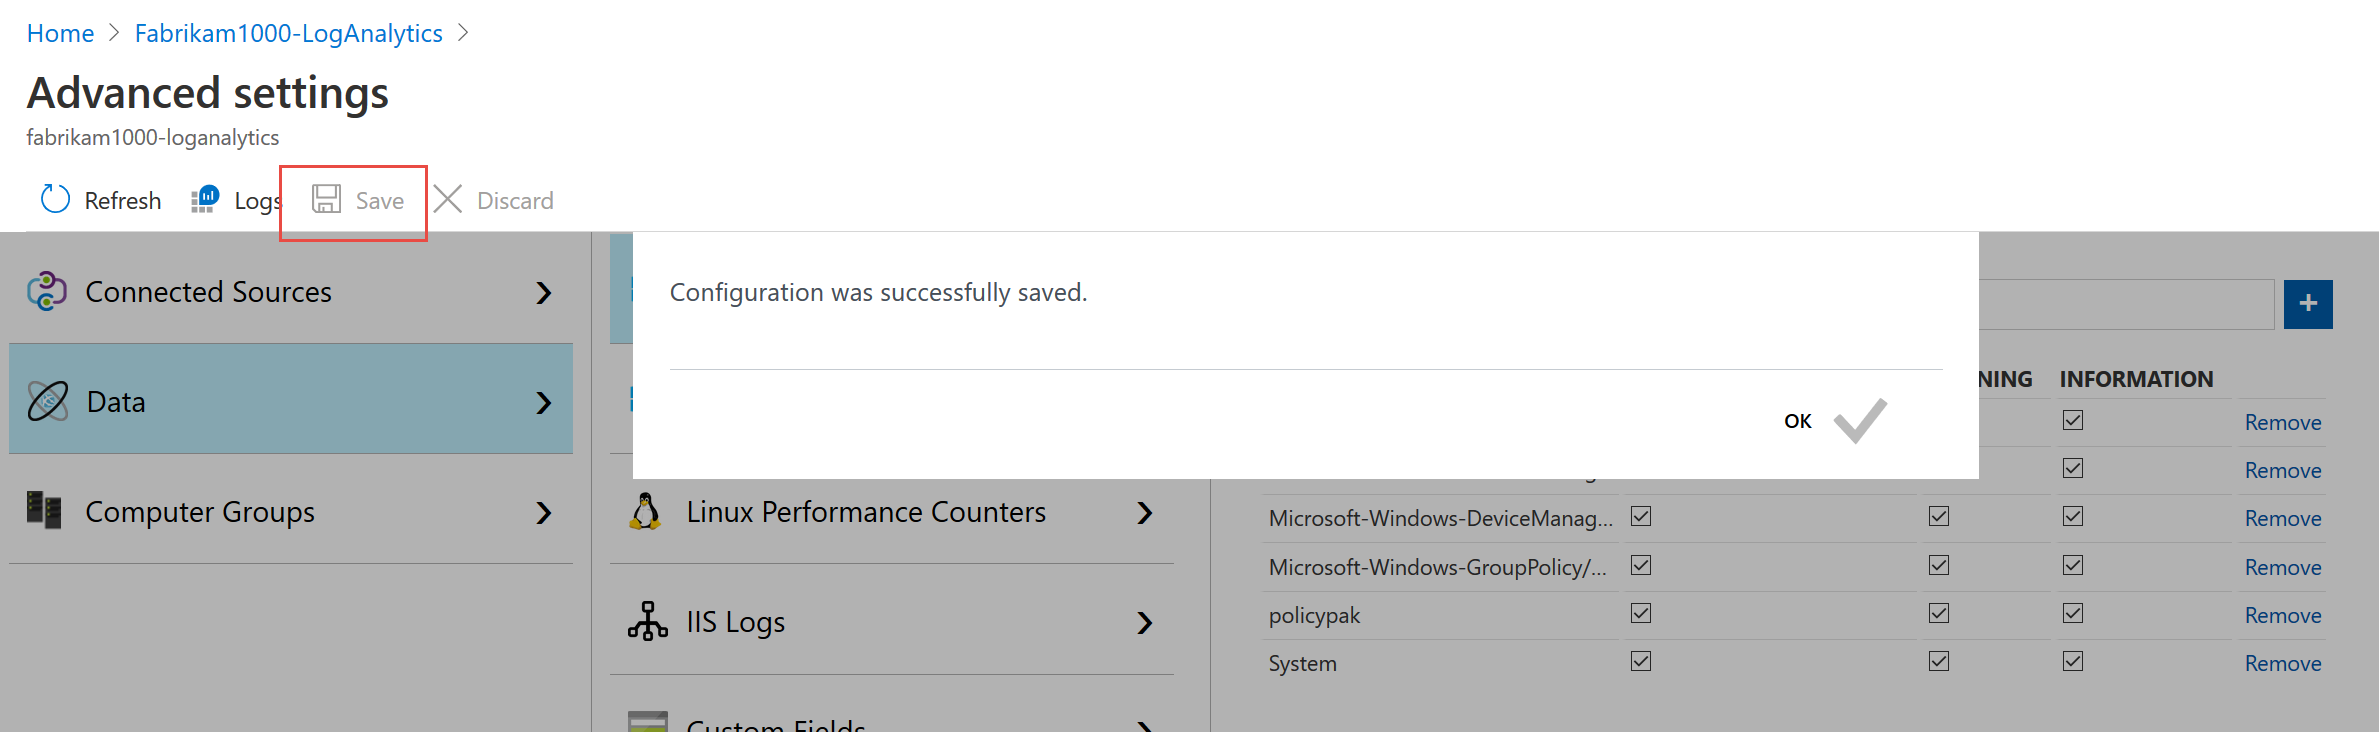
Once I pasted in all the logs and added them, I clicked Save and got this !
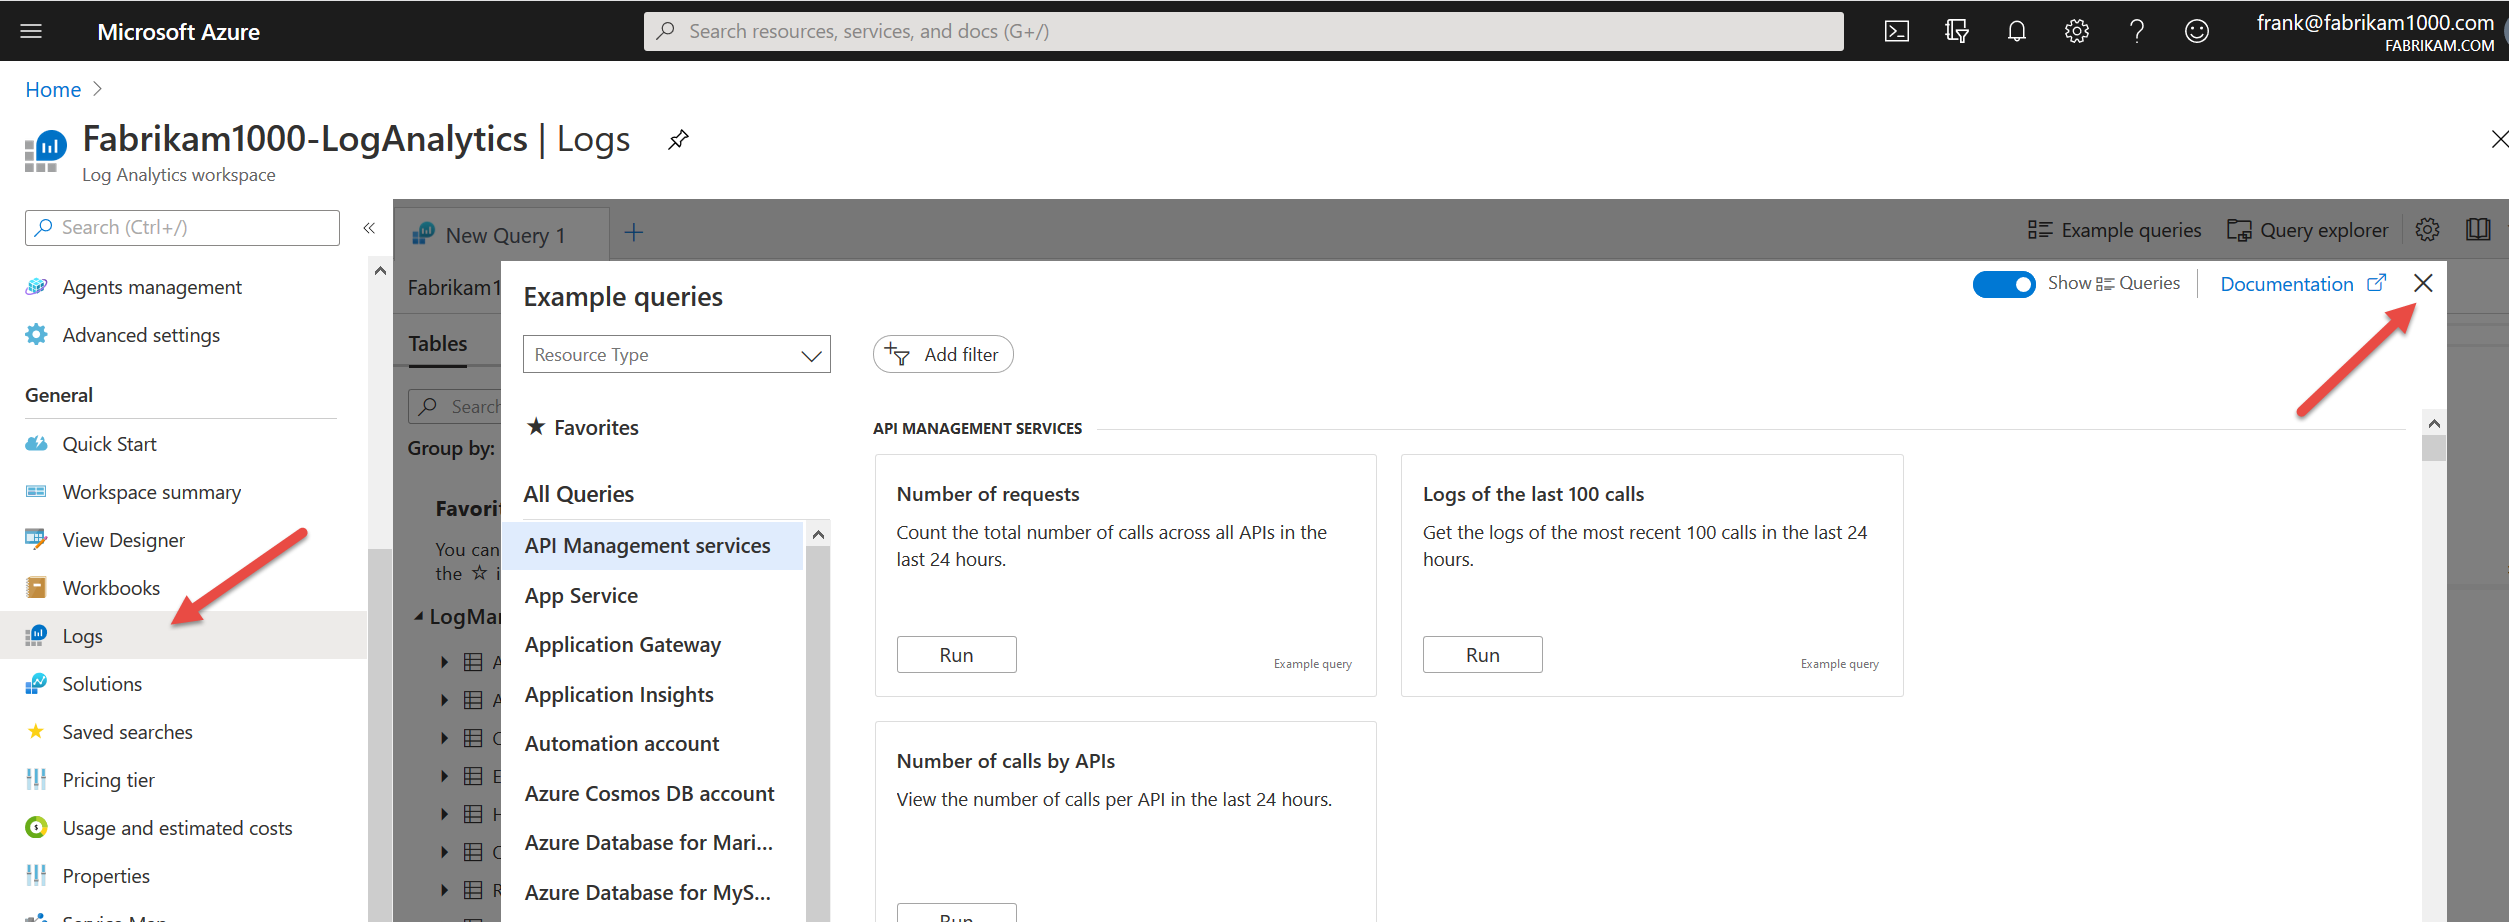
Data.. data? Do we have data ? Click on Logs and close the sample queries. Let’s just see what have. All of it (which shouldn’t be much.)
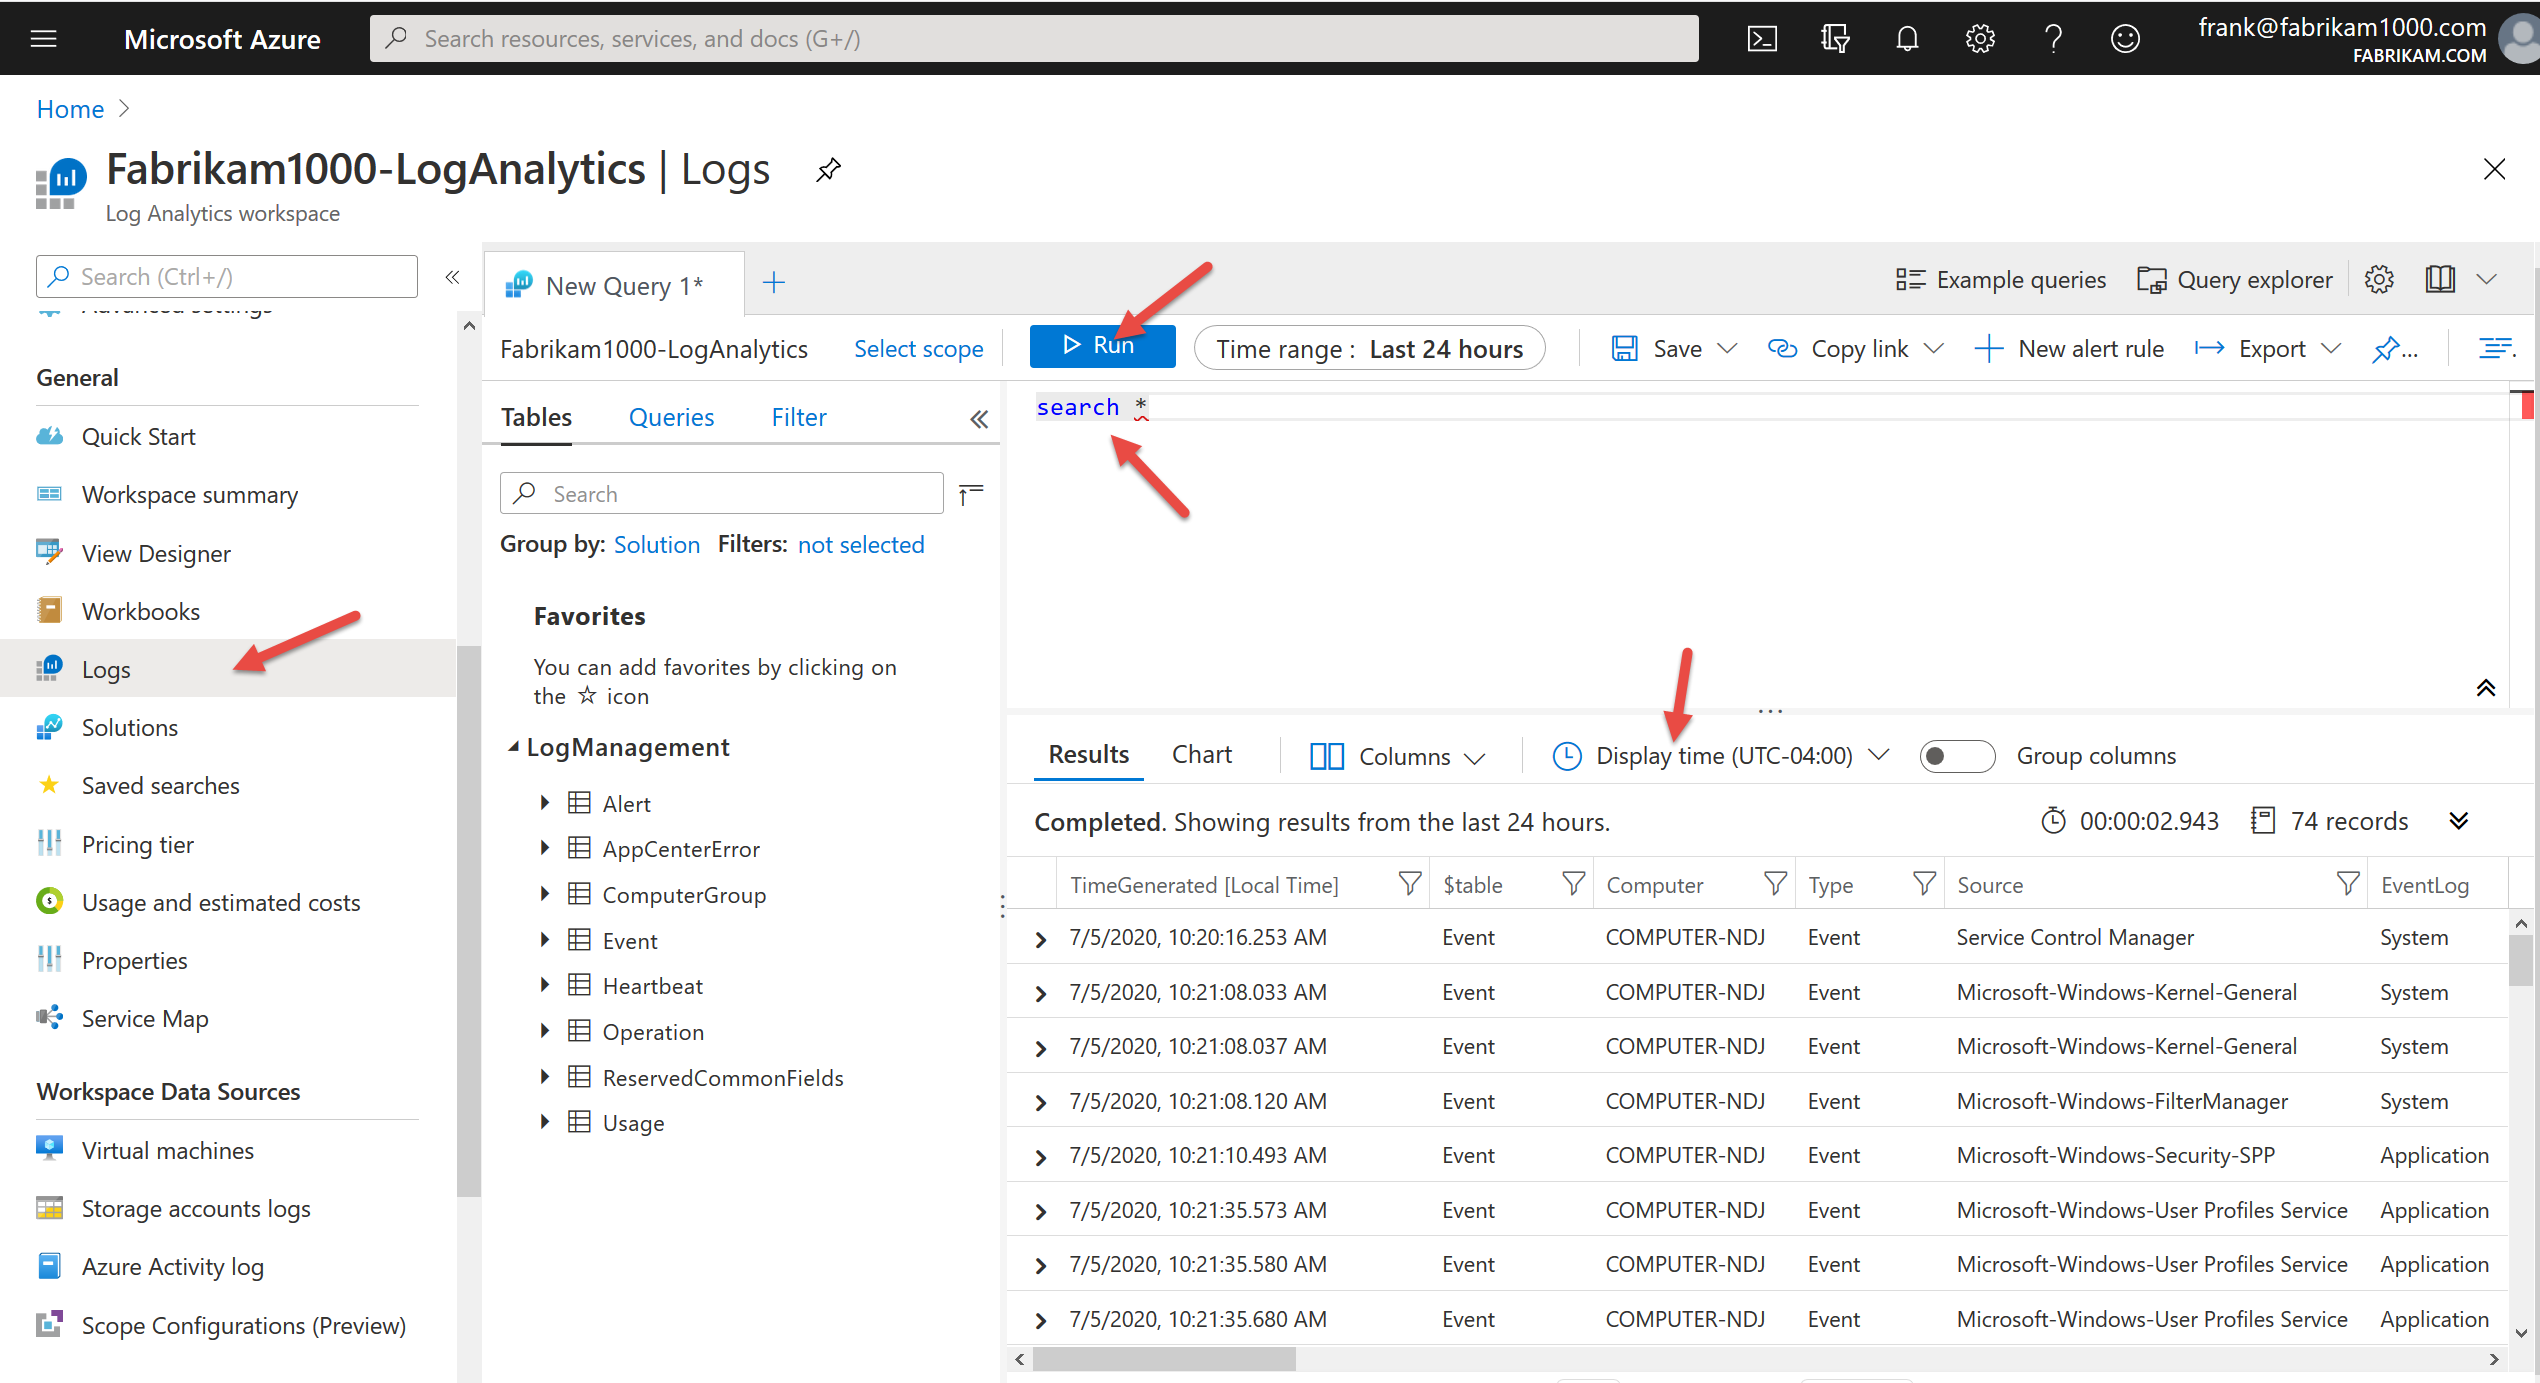
In the top box, type
SEARCH *
Then click Run. Bingo.. out should pop all the events that have been captured. You can change the Display Time to make sure that you’re getting the right events, right now.
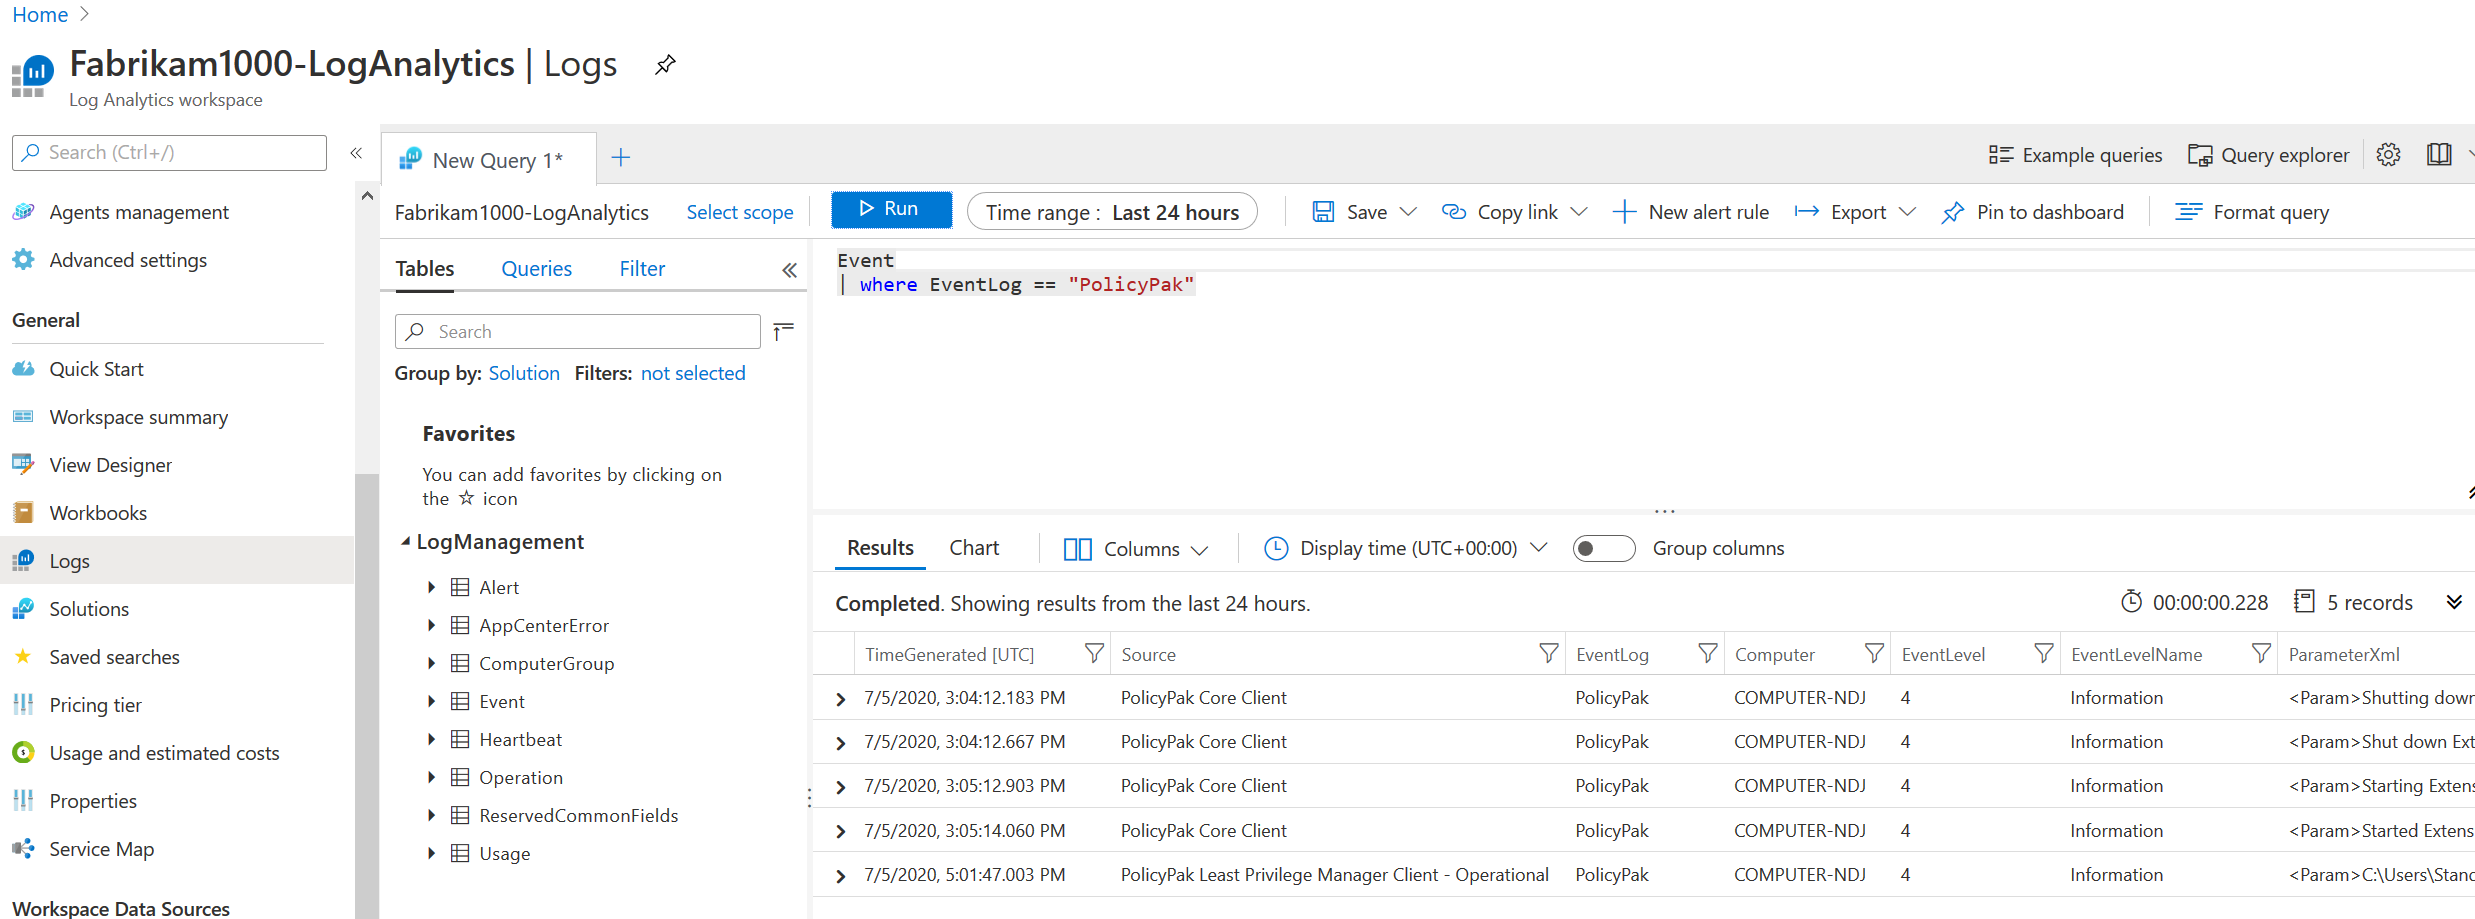
It took a little while for the non-well-known logs to show up. But maybe it will work faster for you than for me. If you want to give it a shot and try your non-well-known logs, like this, give it a go.
Event | where Eventlog == "PolicyPak"
Then click Run again.
Pow! Here come your logs.
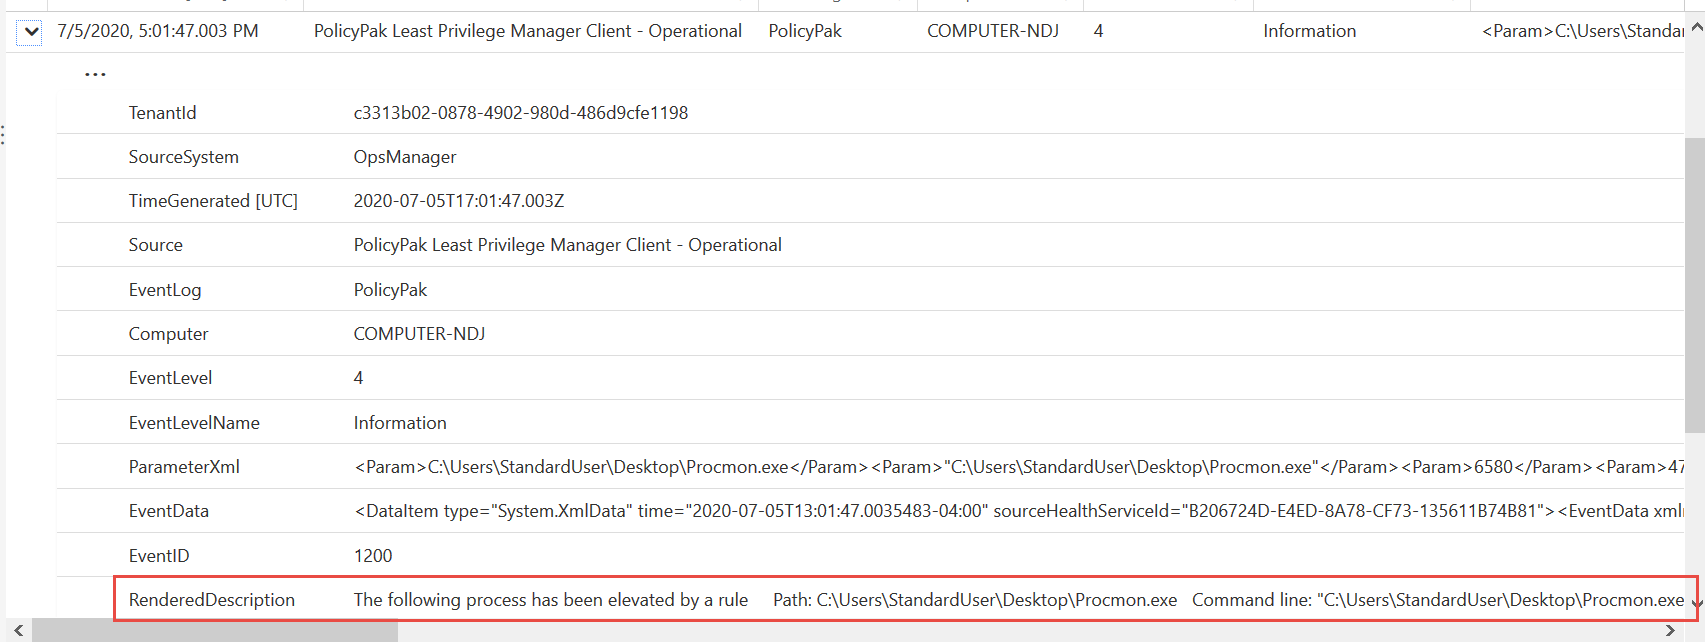
Then I can also dig into an event, and … hey look ! EastSalesUser1 ran Procmon, and PolicyPak did the elevation ! Amazeballs !
That’s it. Well, that’s basics anyway.
Remember this blog is a simple walkthrough / getting started. This isn’t “Magic Tricks with Windows Analytics.” But if I had this guide, I would have been up and running about 10x faster. So I hope this helps you out and shows how you can take on-prem or “Always on the go” Windows 10 machines and record their logs, then sort thru them for actionable items and trends.

Comments (0)